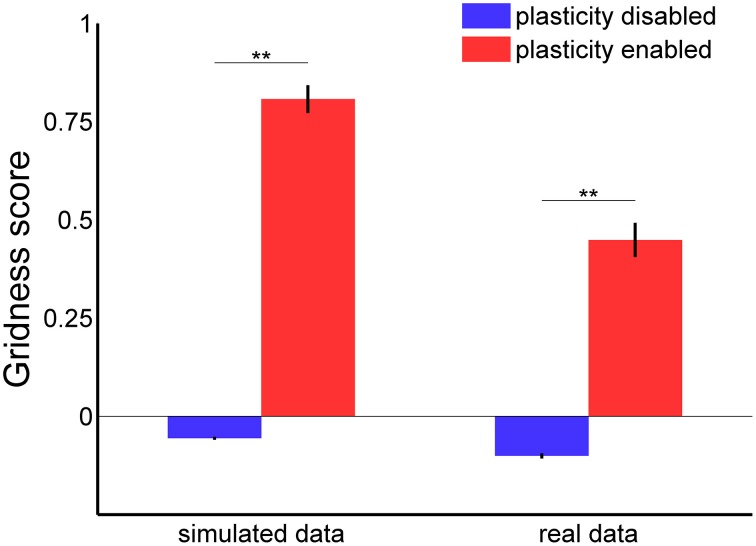
Figure 9.
Gridness score average with and without stabilization mechanism for grid cell simulations with simulated (left) and real data (right) in input. For each experimental session we considered the activity of one single grid cell in the middle of the network. In both simulated and real conditions there is a significant difference in the average gridness score [one-way ANOVA, F(3, 396) = 234.8 with Bonferroni correction, **p < 0.01].

