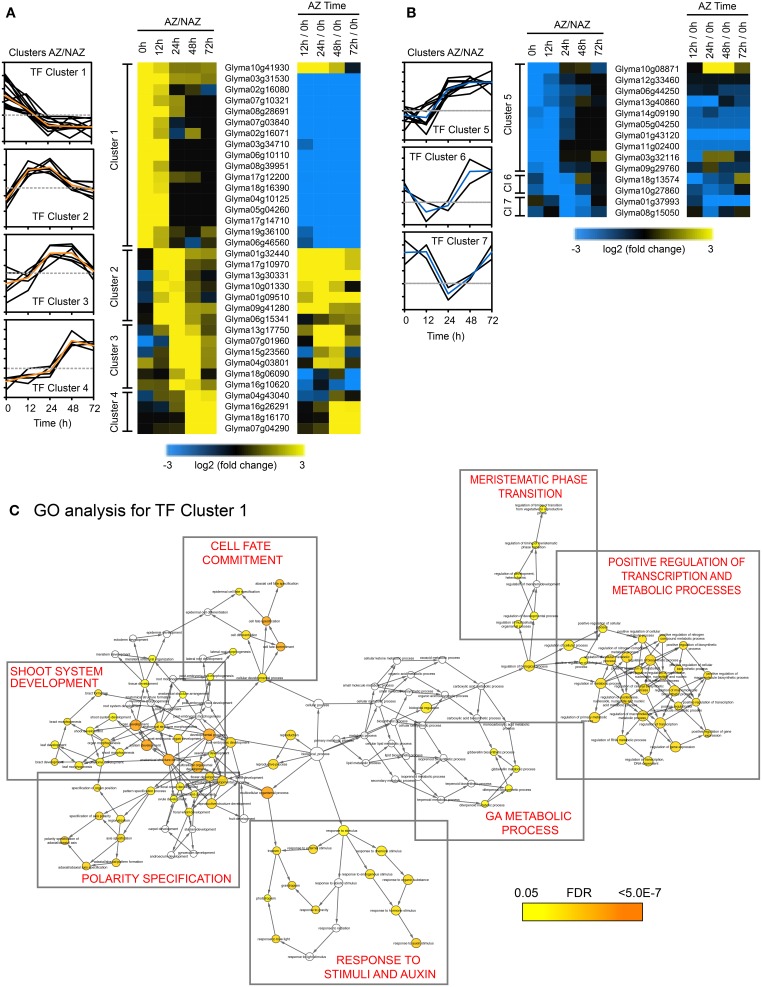
Figure 3.
Cluster analysis of abscission-specific transcription factors (188 TFs) more or less abundant in the AZ at two consecutive time points in soybean leaf abscission (48 TFs). (A) Heat map display of the 34 abscission-specific TFs that clustered based on expression greater than four-fold in the LAZ relative to the petiole (NAZ) (log2 > 2, p < 0.015) in two consecutive time points (i.e., LAZ/NAZ at 0 and 12 h, 12 and 24 h, 24 and 48 h, and 48 and 72 h). Change in expression for the same TFs in the LAZ over time (i.e., expression in LAZ at 12/0, 24/0, 48/0, and 72/0 h). (B) Similar heat map display of the 14 abscission-specific TFs that clustered based on expression of four-fold less in the LAZ relative to the NAZ (log2 < −2, p < 0.015) in two consecutive time points. (C) Gene Ontology (GO) term network analysis (BiNGO) for TF Cluster 1 having four-fold higher expression in the LAZ/NAZ at 0 and 12 h. Enrichment clusters with similar biological processes are boxed and a summary of the biological process is printed in red inside the box. The range of colors from yellow to orange inside the circles for each identified biological process indicates the statistical significance from 0.05 to < 5 × 10⁻⁷, respectively, for the enrichment of the GO term in the test set, Cluster 1 TFs, (Maere et al., 2005). The color bar at the bottom right reflects the range of statistical significance where the p-value was adjusted using a Benjamini and Hochberg False Discovery Rate (FDR) correction.

