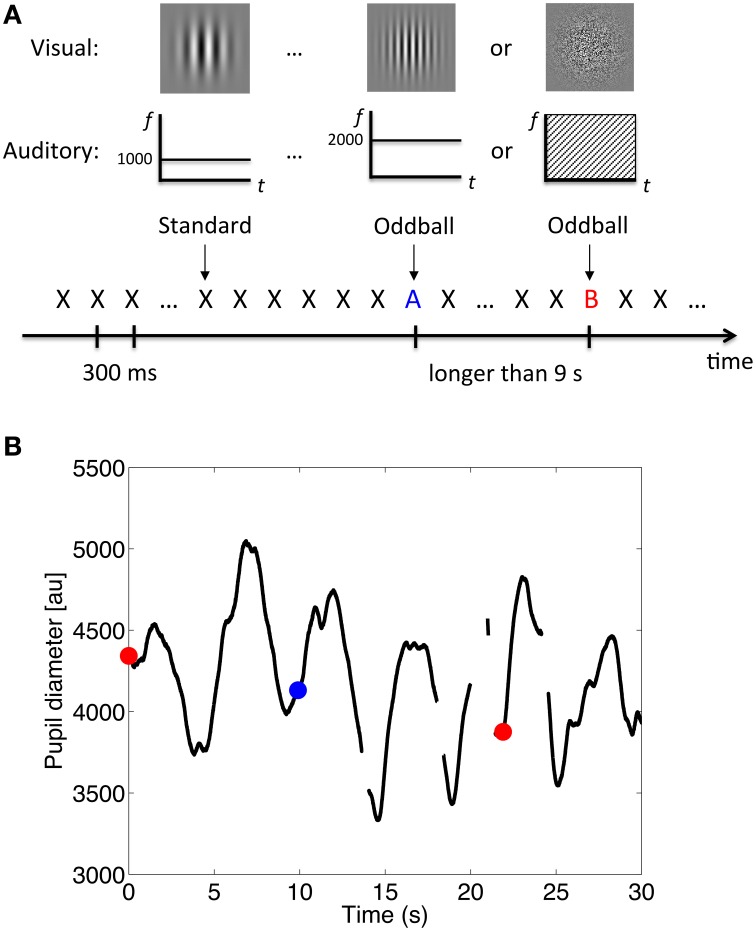
Figure 1.
Procedure and example of the results. (A) Schematic illustration of the stimulus sequence, where X, A, and B, represent the auditory and visual stimuli. (B) Example of pupil diameter changes over time. Data during blinks were treated as missing (the off-line segments). The red dots represent the onset of the white-noise oddballs; the blue dot represents the onset of the 2000-Hz-tone oddballs.

