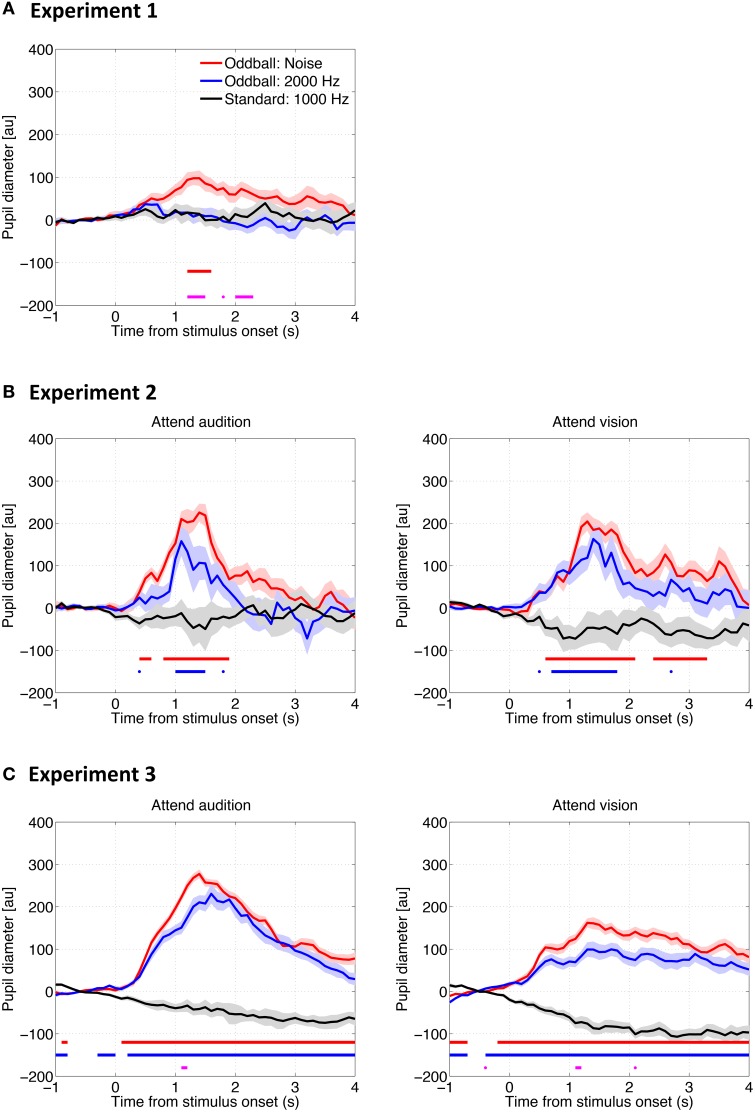
Figure 2.
Pupil diameter change as a function of time relative to the auditory stimulus onset in Experiment 1 (A), Experiment 2 (B), and Experiment 3 (C). The solid lines represent the median of the pupil diameter derived from all trials for all participants as a function of time relative to the auditory stimulus onset. The shadows represent the standard error derived from a bootstrapping procedure (resampling n = 1500). The horizontal red and blue lines represent statistical differences between the baseline (i.e., the response to the standard tones) and the noise and 2000-Hz oddballs, respectively. The horizontal magenta line represents the difference between the two types of oddballs (bootstrapping, with the Bonferroni correction).

