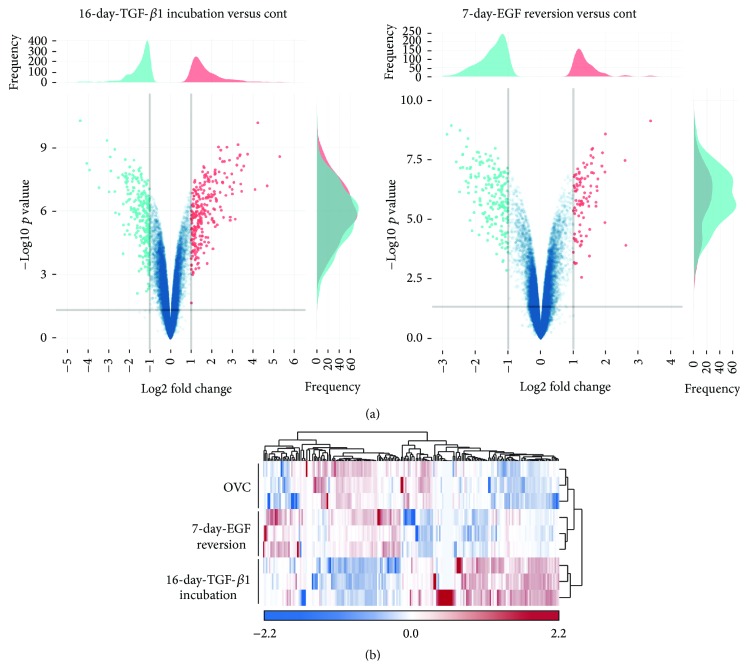
Figure 5.
Differential gene expression of hepatic oval cells, 16-day TGF-β1 treated cells, and 7-day EGF-reversion cells. (a) Volcano plots contrast significance as the negative logarithm of the p value against log2 fold change between 16-day TGF-β1 treated versus control and 7-day EGF reversion versus control cells. (b) Hierarchical clustering analysis based on 200 genes significantly differentially expressed between hepatic oval cells, 16-day TGF-β1 treated oval cells, and 7-day EGF-reversion oval cells. Scaled expression values were shown for each group with light blue being the lowest and light red as the highest expression level.

