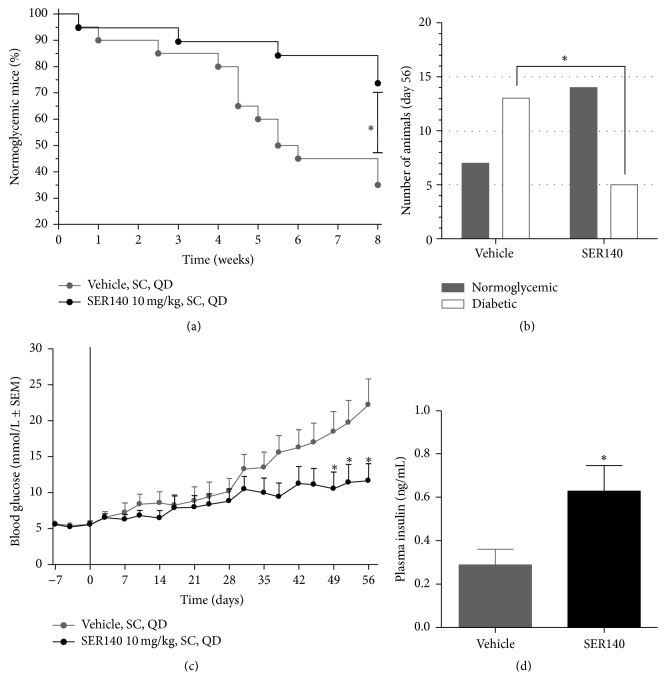
Figure 2.
Development of diabetes in NOD mice. (a) Proportion of mice (percentile) having normal glucose levels defined as nonfasting BG below 10 mmol/L from day 0 to day 56. (b) Number of normoglycemic versus diabetic animals at day 56. Statistical significance was obtained between the variables (p = 0.025, Fisher's exact test) with a higher incidence of diabetes in the vehicle group ((a) and (b)). (c) Morning fed BG during a time period from day −7 to day 56. (d) Plasma insulin levels at day 56. Unpaired t-test ∗ p < 0.05. ((c) and (d)) Data are presented as mean ± SEM (n = 18–20/group). (c) Two-way ANOVA w/Bonferroni post hoc test. (d) Unpaired t-test. ((c) and (d)) ∗ p < 0.05 compared to vehicle.

