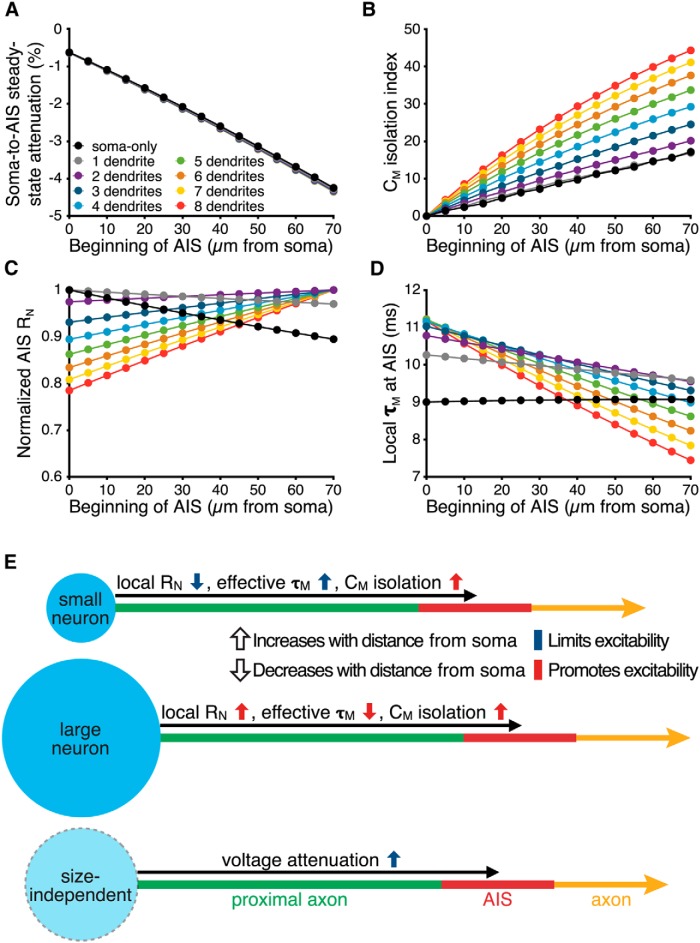
Figure 15.
Mechanisms controlling the impact AIS plasticity. A, Steady-state voltage attenuation, measured in the middle of a 30-µm-long AIS positioned at the indicated distances from the soma (AIS Model C) in response to a somatic current injection (−1 pA) delivered at the resting membrane potential. Data are from model neurons having zero (black symbols) to eight (red symbols) dendrites. B, CM-isolation index (see Methods) vs AIS distance from the soma for neurons having zero to eight dendrites. C, Normalized local steady-state input resistance (RN) vs AIS location. D, Local effective membrane time constant (τM) in the AIS vs distance from the soma. E, Summary diagrams of location-dependent changes in the biophysical properties of the AIS in neurons of different sizes. Arrows indicated the direction of change in the indicated biophysical property as the AIS moves distally away from the soma. Arrow colors indicate whether such changes will limit (blue) or enhance (red) neuron excitability.

