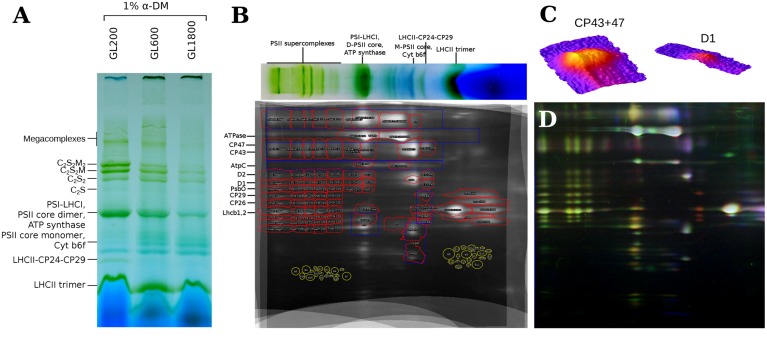
FIGURE 2.
2D-PAGE of thylakoids isolated from plants grown under different light intensities. (A) The BN-PAGE of thylakoids isolated from plants grown under GL200, 600, and 1800, solubilized with 1% α-DDM. (B) Sum of nine 2D-PAGE gels of isolated thylakoids from plants grown under all light conditions. The red contours represent ROIs of selected proteins in specific complexes. The blue contours represent the integrated areas for quantification of a selected protein independent of the complex. On the top, a lane from the BN-PAGE is shown. (C) Overlap of the gels of thylakoids from plants grown under GL200, 600, and 1800, that are shown in the red, green, and blue channels, respectively. (D) 3D surface plots of CP43 + 47 and D1 megacomplex ROIs, respectively.

