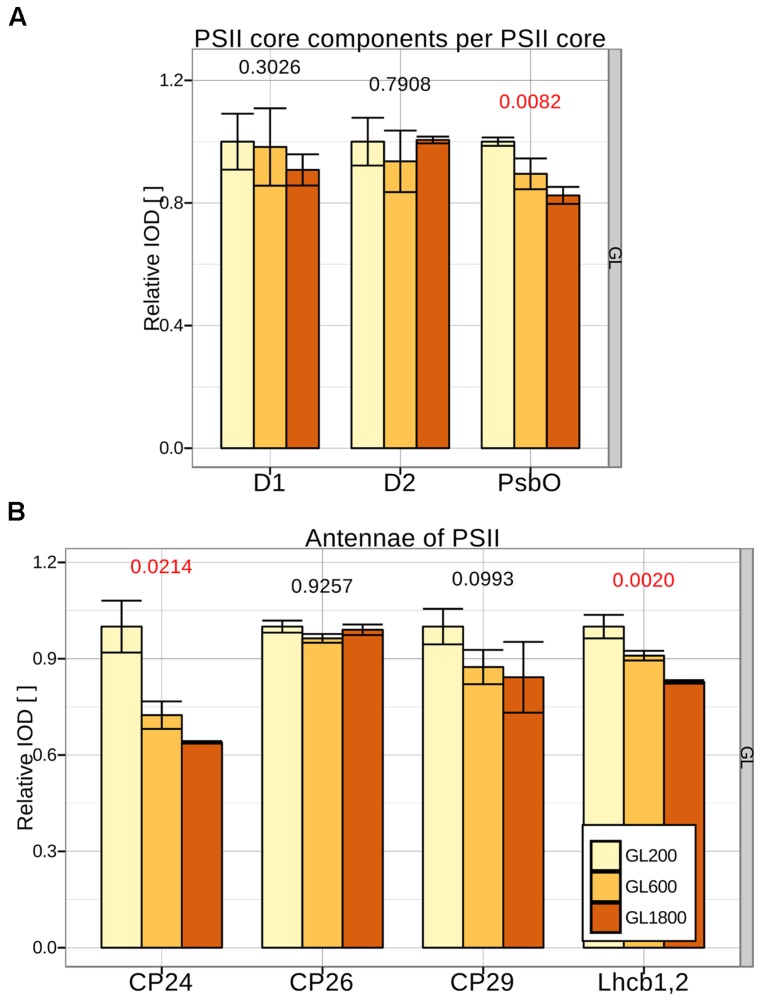
FIGURE 3.
Changes in the PSII composition during long-term acclimation to different light intensities. (A) The amount of PSII core proteins: D1, D2, and PsbO per CP43, 47 was quantified in isolated thylakoids from plants grown under GL200, 600, and 1800 (respectively, yellow, orange, and brown fill) separated during 2D-PAGE in three different repetitions (n = 3). (B) The amount of minor PSII antennae: CP24, CP26, CP29, and Lhcb1,2 per PSII core was quantified in isolated thylakoids from the same samples. Numbers below the bars are the p-values of ANOVA’s F-test on a specific group. Red color signifies rejection of the null hypothesis that the response to all growth lights is the same (α < 0.05), black its acceptance.

