FIGURE 5.
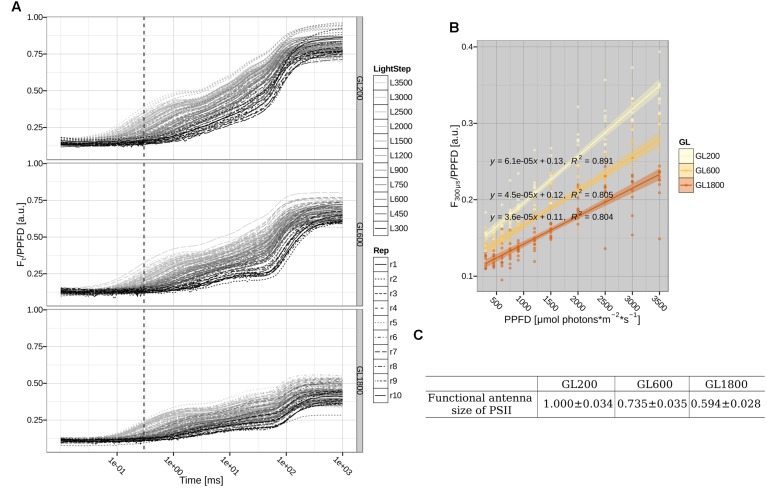
Functional antenna size of PSII. (A) Direct measurements of chlorophyll a fluorescence in folio during a 1 s pulse of 300, 450, 600, 750, 900, 1200, 1500, 2000, 2500, 3000, and 3500 μmol photons∗m–2∗s–1 were normalized to the photosynthetic photon flux density (PPFD). The dotted, vertical line shows the 300 μs time point. Shown traces for 10 different plants (Rep1-10, respectively, represented by different line types) grown under GL200, 600, and 1800 (respectively, Top, Central, and Bottom Left panels). (B) Relationship between normalized fluorescence at 300 μs and PPFD fitted with a linear regression. The fitted lines with their standard error are shown as lines with shadows. Individual data points are from the plants grown under GL200, 600, and 1800, yellow, orange, and brown color, respectively. (C) The slope and standard error of a fit of the normalized fluorescence at 300 μs against PPFD relationship corresponding to the functional antenna size of PSII on 10 different plants (n = 10) grown under GL200, 600, and 1800.

