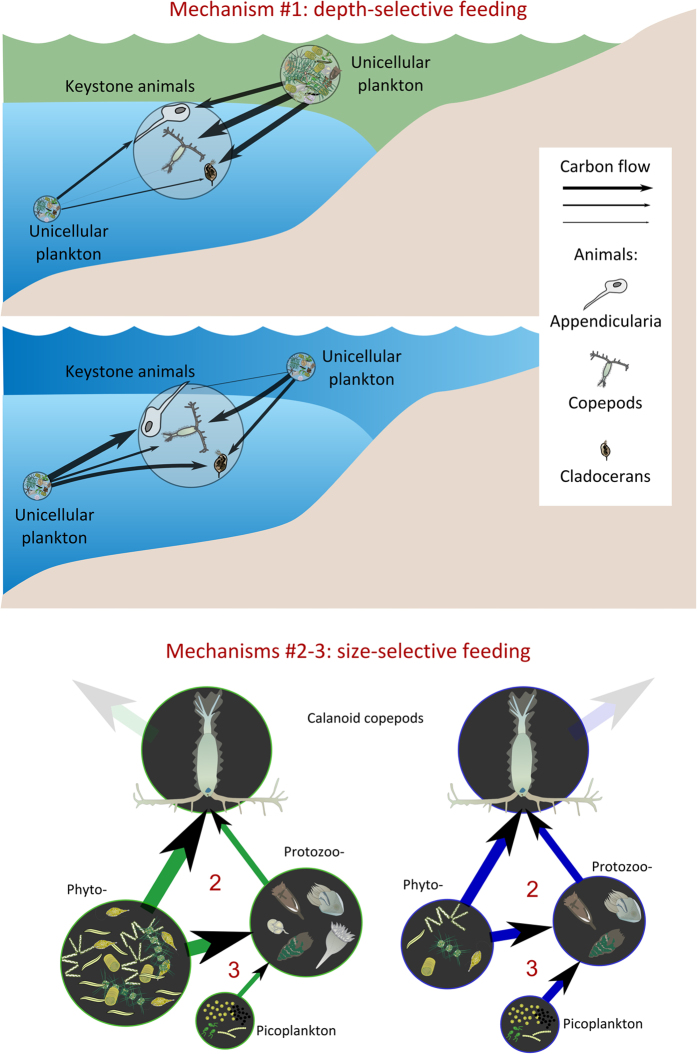
Figure 2. Schematic depiction of the main differences in trophic fluxes among the green and blue states.
In the uppermost panels, the increasing of material fluxes from the deeper layer to the main metazoan consumers. In the lowermost schemes, from green to blue states, the increasing of fluxes from picoplankton to protozoan consumers and from the latter to calanoid copepods.

