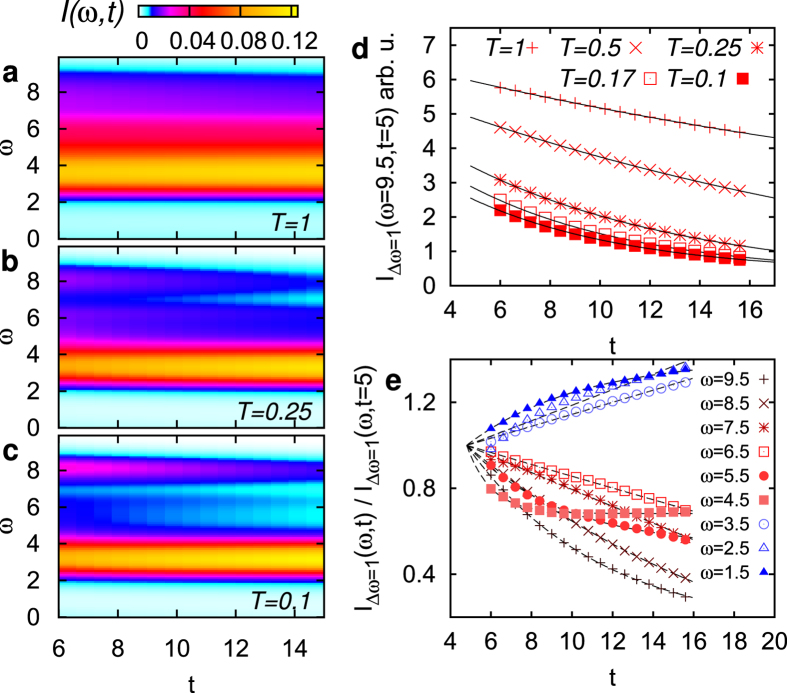
Figure 3. Time dependent energy distribution of the photo-carriers.
(a–c) time-dependent photo-emission spectrum in the upper Hubbard band, for three different temperatures. (Half-filled insulator at U = 12, amplitude E0 = 6, Nex ≈ 0.9%). (d) PES weight integrated in the high-energy window 9 ≤ ω ≤ 10 for various temperatures. The solid lines are exponential fits. (e) Frequency dependence of the relaxation for low temperatures, T = 0.1. These curves are normalized at t = 5.

