
Figure 5. Fluence dependence of the time-resolved spectral function A(ω, t).
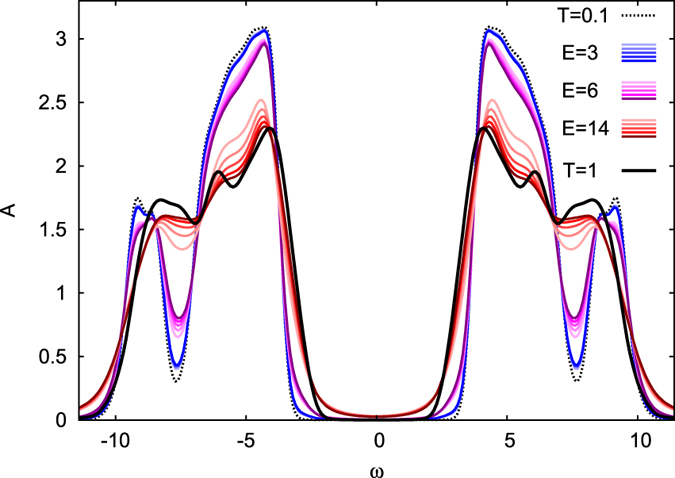
The figure shows results for a half-filled insulator at U = 12, β = 10 for three fluences (E0 = 3, Nex ≈ 0.2%; E0 = 6, Nex ≈ 0.9%; E0 = 14, Nex ≈ 4.5%) and various times (t = 6, 8.4, 10.6, 12, 14.4 from light to dark colors). The thick black solid line is the spectral function at high temperature T = 1, the dashed line is the spectral function at he initial temperature T = 0.1. For high fluences, the spectrum around the Hubbard bands becomes more similar to the high-temperature spectrum at half-filling. However, the spectrum does not indicate thermalization. The larger number of mobile carriers of the photo-induced state is reflected in the accumulation of spectral weight in the gap.