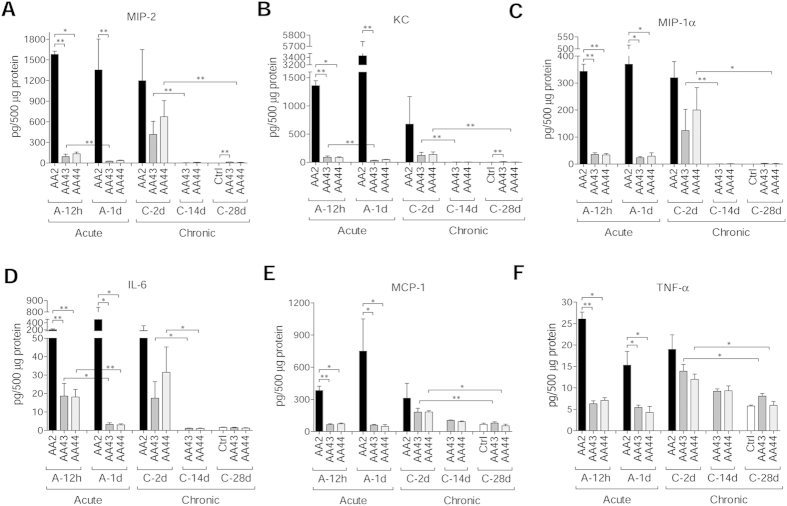
Figure 3. Cytokines/chemokines profiles in murine models after P. aeruginosa infection.
C57Bl/6NCrlBR mice were infected with 5 × 10⁶ CFU/lung of planktonic bacteria for the acute infection or 1 to 2 × 10⁶ CFU/lung of strains embedded in agar beads for the chronic infection and analyzed during a time course post-infection (12 hours and 1 day of acute infection and 2, 14 and 28 days of chronic lung infection). Cytokines and chemokines, including MIP-2 (A), KC (B), MIP-1α (C), IL-6 (D), MCP-1 (E) and TNF-α (F), were measured by Bioplex in lung homogenates. The data are pooled from at least two independent experiments (n = 3–6). Values represent the mean ± SEM. Statistical significance is indicated: *P < 0.05, **P < 0.01.

