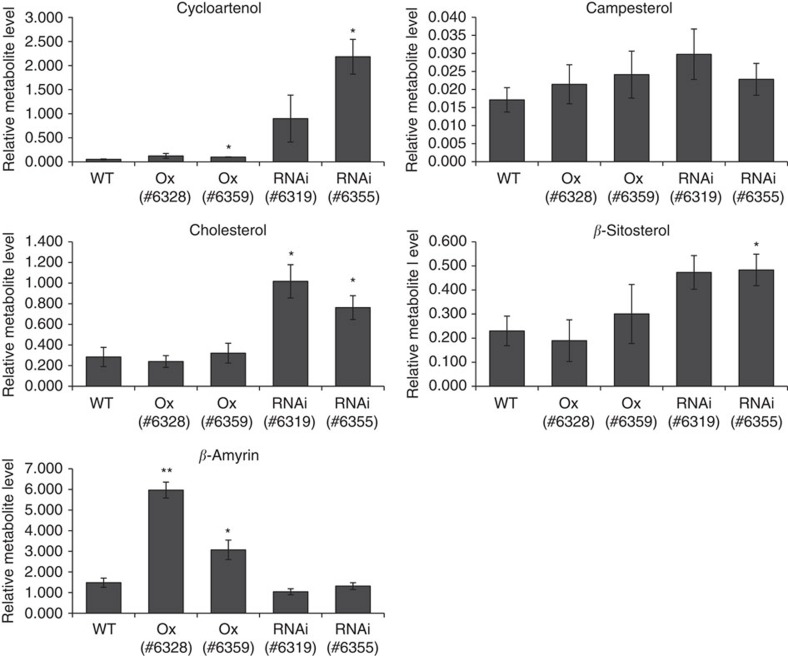
Figure 5. Cholesterol and other sterols levels in tomato GAME9-Ox and GAME9-RNAi lines.
Relative abundance of five sterols in leaves of two independent GAME9-Ox and two independent GAME9-RNAi plant lines as compared to wild-type (WT) measured using GC–MS. Epicholesterol was used as an internal standard. Relative metabolite levels are expressed as ratios of peak areas compared to internal standard. Values represent means±s.e. (n=3). Student's t-test was used to assess whether the transgenic lines significantly differ from wild-type plants: *P value<0.05; **P value<0.01.

