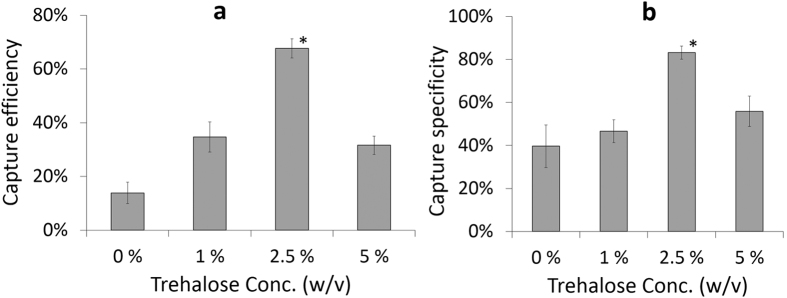
Figure 3. Optimization of trehalose concentration for stabilization of surface chemistry inside microfluidic channels.
Comparison of CD4 T cell (a) capture efficiency and (b) capture specificity at different trehalose concentrations (w/v); 0%, 1%, 2.5%, and 5%. The devices were preserved for 2 weeks at room temperature before testing (*p < 0.05 between devices preserved at 2.5% trehalose (w/v) and other concentrations, n = 3).

