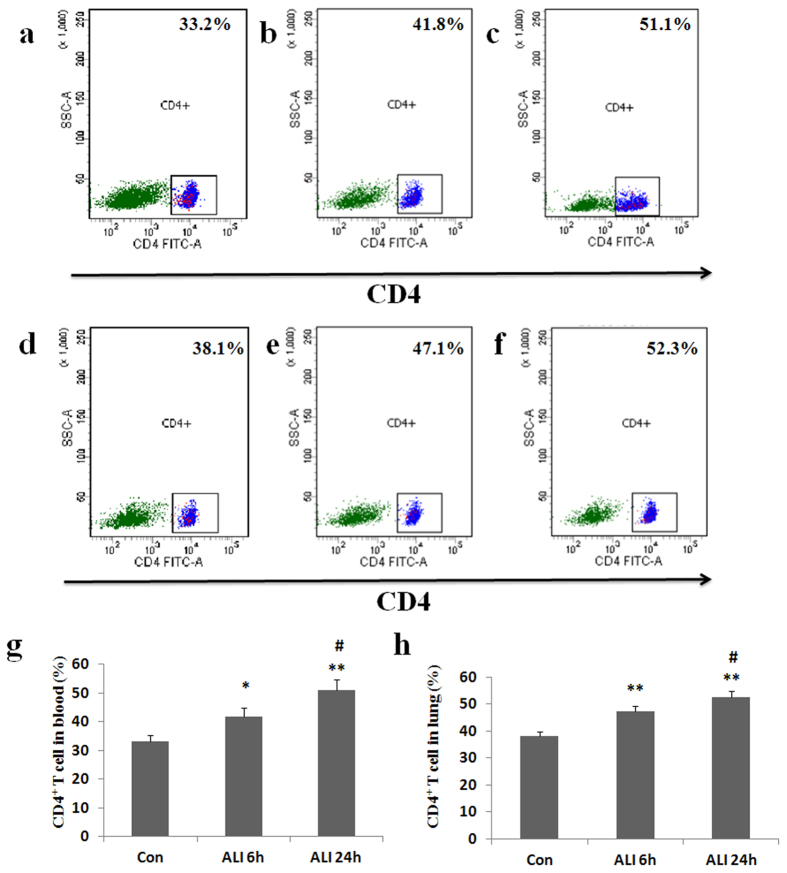
Figure 3. Expression of CD4+ T cells.
Lymphocytes were surface-stained with CD4 antibody, and analyzed by flow cytometry. (a) CD4+ T subsets were gated by flow cytometry in Con group in peripheral blood; (b) CD4+ T subsets were gated by flow cytometry in ALI 6 h group in peripheral blood; (c) CD4+ T subsets were gated by flow cytometry in ALI 24 h group in peripheral blood; (d) CD4+ T subsets were gated by flow cytometry in Con group in lung; (e) CD4+ T subsets were gated by flow cytometry in ALI 6 h group in lung; (f) CD4+ T subsets were gated by flow cytometry in ALI 24 h group in lung; (g) The percentage of CD4+ T cells in peripheral blood were presented as mean ± S.E.M; (h) The percentage of CD4+ T cells in lung were presented as mean ± S.E.M. Con (normal control group, ambient air inhalation, n = 10), ALI 6 h (ALI group, smoke inhalation for 6 h, n = 10), ALI 24 h (ALI group, smoke inhalation for 24 h, n = 10). *P < 0.05 and **P < 0.01 versus normal control group; #P < 0.05 and ##P < 0.01 versus ALI 6 h group.

