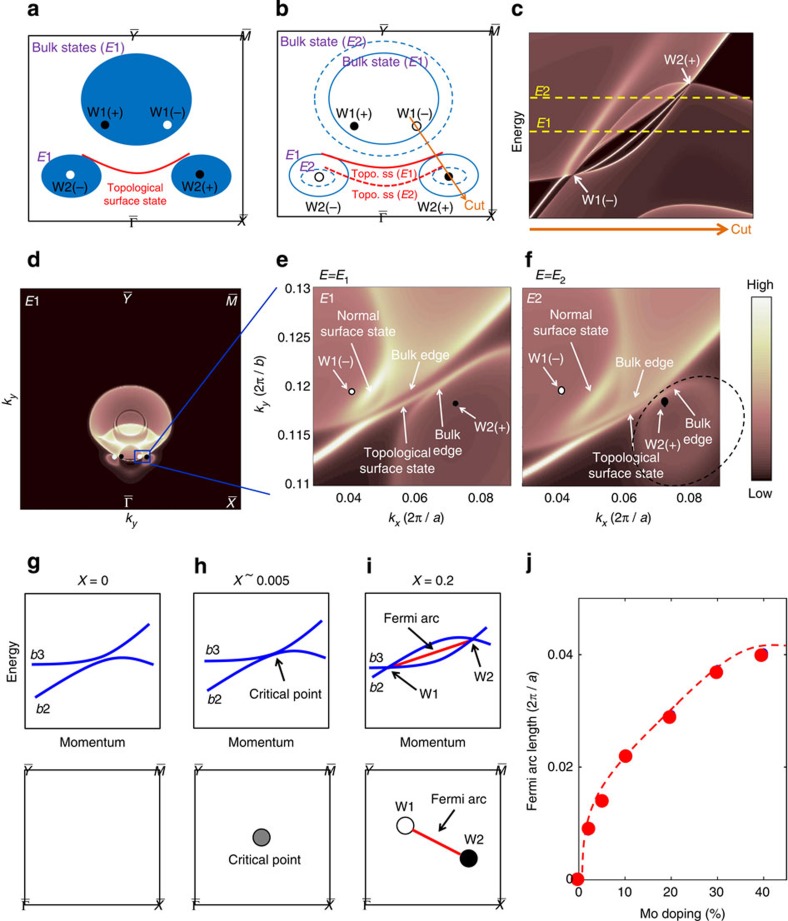
Figure 4. Iso-energy contour interconnectivity on the surface of MoxW1−xTe2.
(a) Schematic illustration of the surface and bulk electronic structure on a constant energy E1. The shaded areas represent the projected bulk bands, whereas the red line show the surface states. (b) Schematic illustration of the surface and bulk electronic structure on two energies E1 and E2. The band structure on E1 (E2) are shown by the solid (dotted) lines. The energies E1 and E2 are defined in c. (c) Band structure along a k space cut that goes through the direct pair of Weyl nodes, W1(−) and W2(+). The dotted lines denote the energies E1 and E2 with respect to the W1 and W2 Weyl nodes. (d) Calculated surface and bulk electronic structure on at the energy E1 over the top half of the surface BZ. (e) A zoomed-in view of d for the area highlighted by the blue box. (f) The same as e but at the energy E2. (g–i) Schematic band diagram to show the evolution of the MoxW1−xTe2 system as a function of Mo concentration x. (j) The length of the Fermi arc as a function of Mo concentration x. The arc length equals the k space separation of the Weyl nodes.

