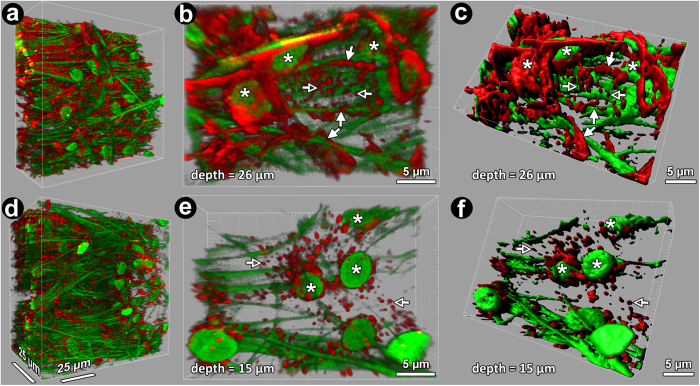
Figure 5.
3-dimensional (3D) reconstructions of vehicle control (a–c) and latrunculin-A (Lat-A)-treated (d–f) trabecular meshwork (TM). 3D reconstructions were cropped and rotated to show en face and oblique tissue views. Cortical filamentous actin (red: F-actin) networks were prominent amongst nuclei and autofluorescent structures (green) in vehicle controls (a–c) but not in Lat-A-treated tissue (d–f). Punctate actin collections were prominent in Lat-A-treated tissue. b,e): High magnification 3D reconstruction of TM (30 × 20 × 9 μm crop of 246 × 246 × 100 μm 3D volume) showing cortical F-actin network (closed arrows) and punctate perinuclear actin collections (open arrows) associated with autofluorescent fibers and nuclei (asterisks). (c,f): Isosurface maps of F-actin closely correspond to phalloidin-labeled F-actin phalloidin in vehicle control (b vs. c) and Lat-A-treated tissue (e vs f), capturing treatment-induced F-actin network and punctate changes. Asterisks: nuclei; closed arrows: cortical F-actin network; green fibers: autofluorescent structure; green ovals: nuclei; open arrows: punctate F-actin collection; red fluorescence: F-actin.

