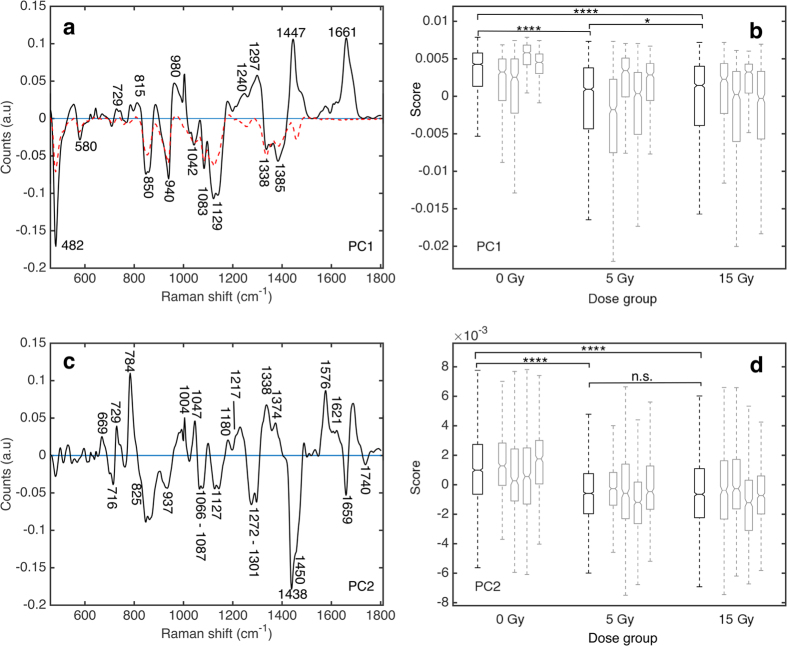
Figure 1. Radiation related Raman spectral changes identified using principal component analysis.
Principal components (PC) 1 (a) and 2 (c) from H460 tumour tissue and corresponding PC score box plots (Tukey style box plot, outliers left out for clarity, notches indicate 95% confidence interval for the median) for PC1 (b) and PC2 (d). A statistically significant shift to more negative median PC1 and PC2 score was found for irradiated tumours compared to unirradiated tumours. Dashed red line in (a) corresponds to the Raman spectrum of pure glycogen (inverted, sample obtained from Life Technologies Inc., Burlington, ON, Canada). Black boxes represent PC score for all spectra collected over four tumours in a single dose group (15 Gy; n = 1969, 5 Gy; n = 2279, 0 Gy; n = 2032). Grey boxes represent PC score for all spectra collected for an individual tumour. Statistical significance was tested using a two-sided Wilcoxon rank sum test to 5% significance level, ****p-value ≤ 0.0001, *p-value ≤ 0.05, n.s. not significant.

