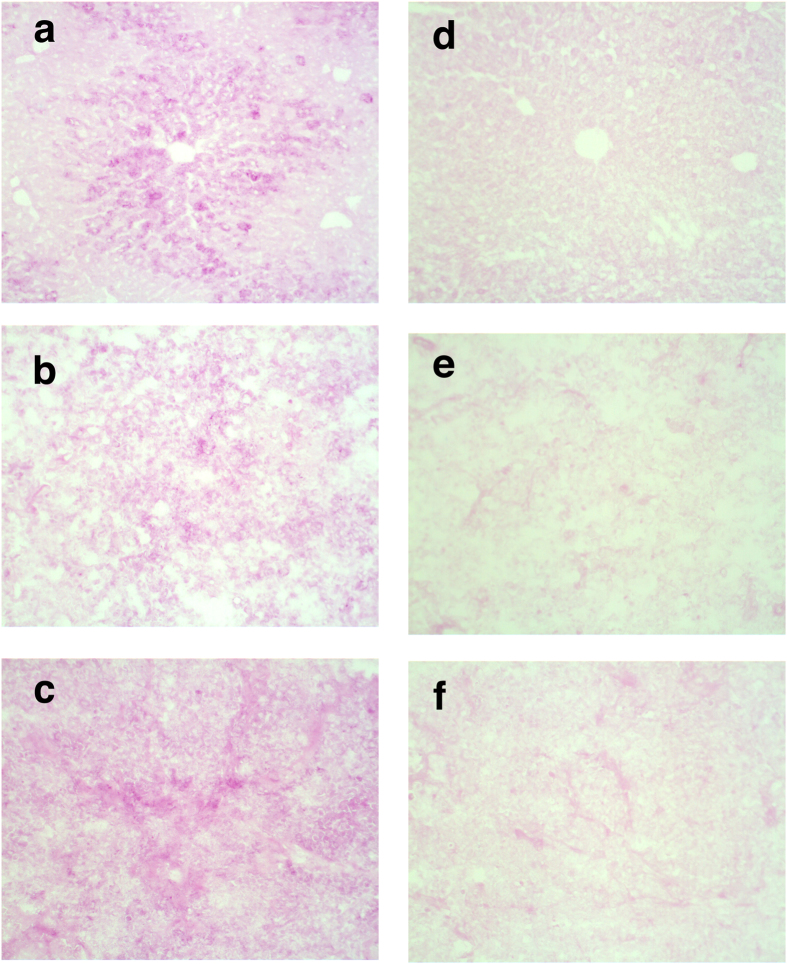
Figure 4. Periodic acid–Schiff (PAS) staining images from irradiated and unirradiated tumour tissue and liver tissue control.
A qualitative indication of increased glycogen content in irradiated (15 Gy) tissue compared to unirradiated (0 Gy) tissue was given by PAS staining. Images are collected at 20× magnification. PAS stained (a) Liver tissue (positive control) without diastase (alpha-amylase) and (d) with diastase. (b) Unirradiated control (0 Gy) H460 tumour tissue without diastase (alpha-amylase) and (e) with diastase. (c) Irradiated (15 Gy) H460 tumour tissue without diastase (alpha-amylase) and (f) with diastase.

