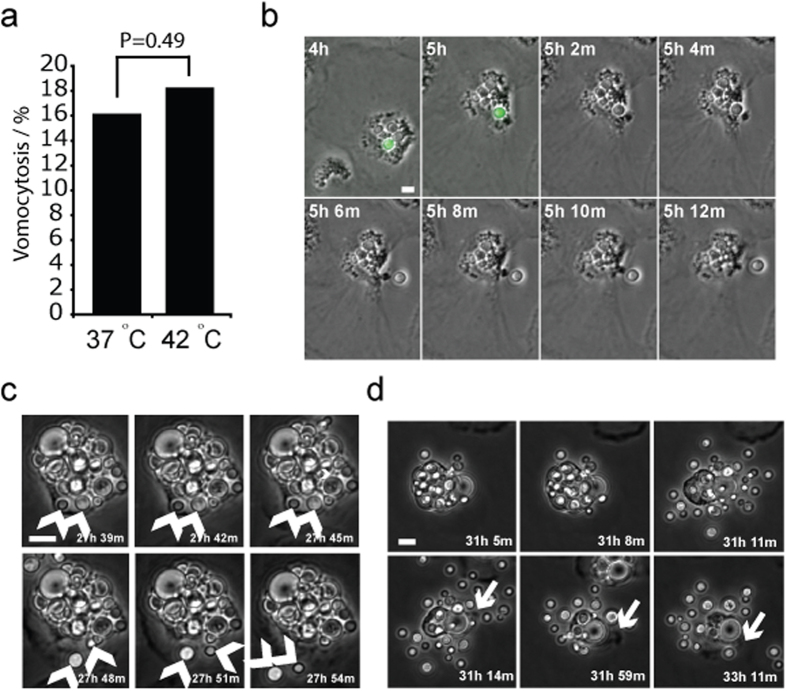
Figure 4. Escape from avian macrophages by vomocytosis.
(a) Quantification of vomocytosis over 24 hours from time lapse microscopy. Pooled data from n = 3 experimental repeats. (b) Example of vomocytosis at 42 °C from Supplementary Movie S2 online. Arrow indicates cryptococcal cell. (c) Example of single vomocytic event at 37 °C from Supplementary Movie S3 online. Arrows indicate cryptococci before and after vomocytosis. (d) Example of large vacuole vomocytosis at 37 °C from Supplementary Movie S4 online. Arrow indicates ruffling of macrophage pseudopod post vomocytosis showing that cell is entirely viable post expulsion. Scale bars 10 μm.

