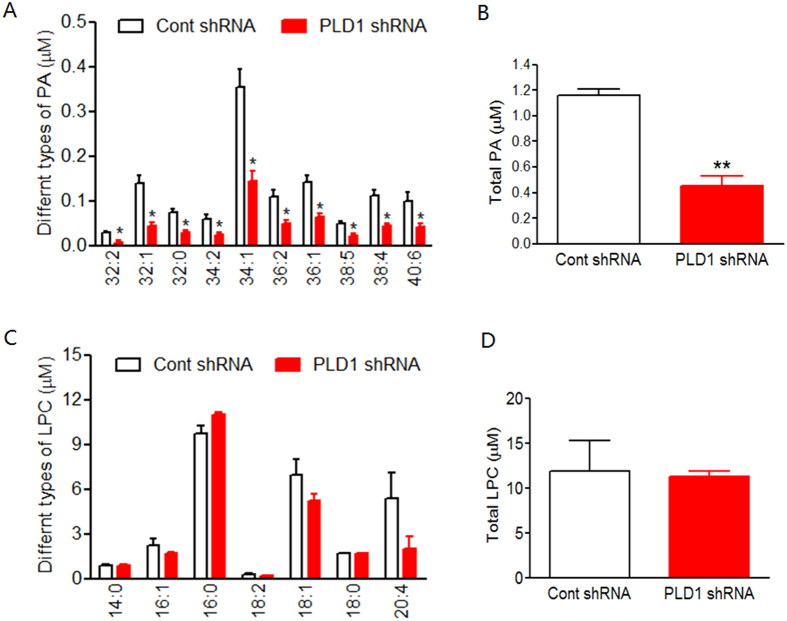
Figure 3. Concentration of PA and LPC in DIV 15 astrocyte cultured medium (ACM) infected by lentivirus expressing control and PLD1 shRNA.
(A) concentration of different types of PA, *p < 0.05, n = 3 different experiments. (B) concentration of total PA listed in (panel A), *p < 0.05, n = 3 different experiments. (C) concentration of different types of LPC. (D) concentration of total LPC listed in panel C.

