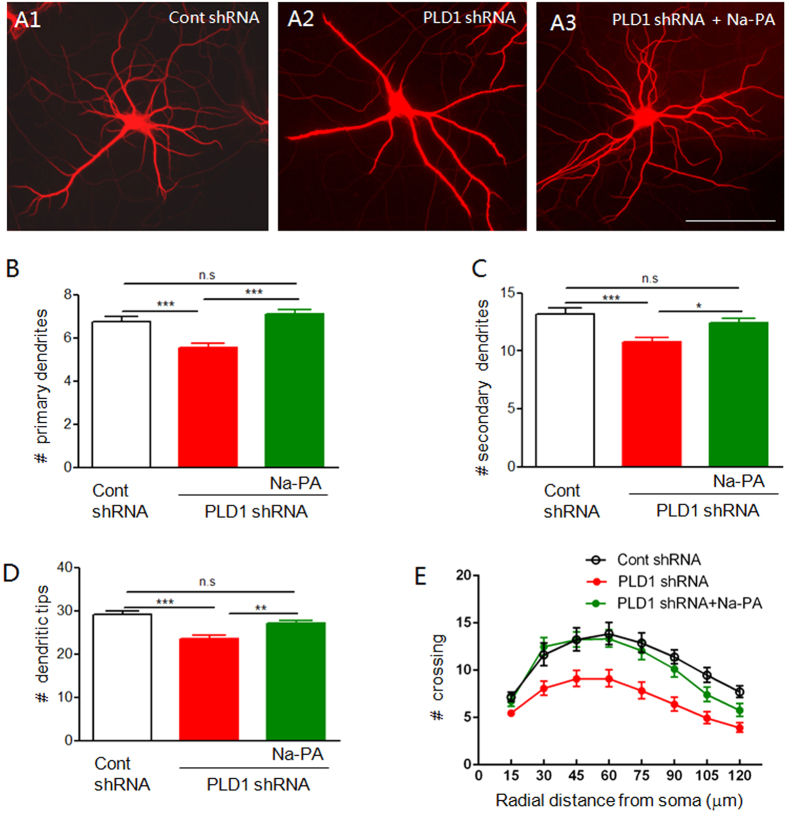
Figure 5. Dendritic branching of neurons grown in sandwich-like coculture.
(A1–3) MAP2 staining of DIV 15 neurons in sandwich-like coculture where astrocytes were infected by lentivirus expressing control shRNA, PLD1 shRNA with and without 1 μM Na-PA treatment. Bar, 100 μm. (B–E) Quantification of primary dendrites (B), secondary dendrites (C), dendritic tips (D) and Sholl analysis (E) for three groups of neurons in panel A, n = 55 neurons for control shRNA, n = 62 neurons for PLD1 shRNA, n = 71 neurons for PLD1 shRNA plus Na-PA, (B–D) *p < 0.05, **p < 0.01, ***p < 0.001, E, F (2, 1224) = 238.5, p < 0.001.

