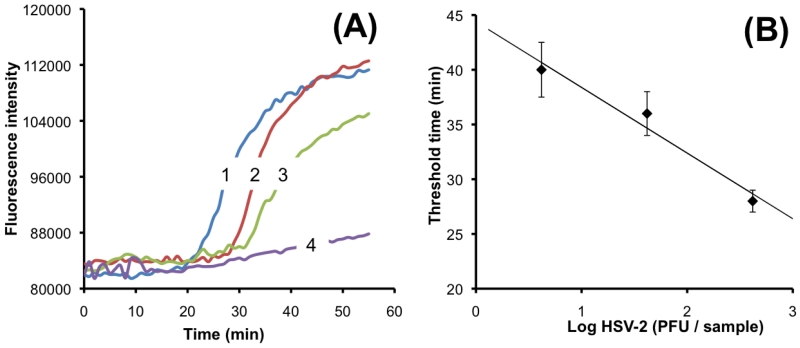
Fig. 3.
(A) Real-time monitoring of LAMP amplification of transport media samples spiked with 420 PFU per sample (curve 1), 42 PFU per sample (curve 2), 4.2 PFU per sample (curve 3), and 0 PFU per sample (curve 4) (negative control). (B) The threshold time Tt (in minutes) is depicted as a function of the HSV-2 concentration (expressed in terms of PFU per sample) (n = 3).

