Summary
There is considerable concern over declines in insect pollinator communities and potential impacts on the pollination of crops and wildflowers1–4. Among the multiple pressures facing pollinators2–4, decreasing floral resources due to habitat loss and degradation has been suggested as a key contributing factor2–8. However, a lack of quantitative data has hampered testing for historical changes in floral resources. Here we show that overall floral rewards can be estimated at a national scale by combining vegetation surveys and direct nectar measurements. We find evidence for substantial losses in nectar resources in England and Wales between the 1930s and 1970s; however, total nectar provision in Great Britain as a whole had stabilised by 1978, and increased from 1998 to 2007. These findings concur with trends in pollinator diversity, which declined in the mid-20th century9 but stabilised more recently10. The diversity of nectar sources declined from 1978 to 1990 but stabilised thereafter at low levels, with four plant species accounting for over 50% of national nectar provision in 2007. Calcareous grassland, broadleaved woodland and neutral grassland are the habitats that produce the greatest amount of nectar per unit area from the most diverse sources, whereas arable land is the poorest in both respects. While agri-environment schemes add resources to arable landscapes, their national contribution is low. Due to their large area, improved grasslands could add substantially to national nectar provision if they were managed to increase floral resource provision. This national-scale assessment of floral resource provision brings new insights into the links between plant and pollinator declines, and offers considerable opportunities for conservation.
Concerns have been raised about declines in both wild and managed insect pollinators1–4. While several potential drivers have been cited2–4, one important factor in pollinator declines may be the loss of floral resources due to changes in land-use and management5–8. Several factors may have caused decreased floral resources in Great Britain and other developed countries, including increased use of herbicides11, destruction of traditional landscape features such as hedgerows12 and loss and degradation of wildflower-rich natural habitats13–15. Current strategies to mitigate pollinator declines focus primarily on enhancing floral resources4, including agri-environmental scheme options such as sowing nectar flower mixtures16,17. There is evidence for declines in some key pollinator forage plants in Great Britain5 and the Netherlands7, but the notion that the overall availability of floral resources has declined is largely based on subjective assessments. Floral resources have never been quantified at national or even landscape scales.
While both nectar and pollen are important floral resources, we focus on nectar because of its importance as an energy source in the diets of adult bees, and because it provides a common currency (total sugars) in which we can express the nutritional contribution of all plant species18. We quantified the nectar resources in Great Britain by combining directly measured and modelled nectar productivity data per unit cover for 260 common plant species (Supplementary Table 11) with historical vegetative cover estimates from the British Countryside Survey19, a representative national-scale survey of plant community composition. Together, the 260 species comprise the vast majority of British nectar sources as they include virtually all nectar-producing plants from the set of species covering 99% of the British land area. Using vegetation data from the latest Countryside Survey (2007), we quantified recent nectar productivity of habitats (nectar sugar per unit area and time) and the diversity of their nectar sources (considering nectar production both by species and by floral morphology groups, referred to as “species nectar diversity” and “functional nectar diversity” respectively). Production was scaled up to estimate national nectar provision using the estimated area of habitats19, allowing the contributions of species, habitats and agri-environment schemes to national nectar provision to be assessed. We estimated historical shifts in nectar provision over recent decades using data from earlier Countryside Survey rounds (1978, 1990, 1998 and 2007), considering both changes in nectar productivity within habitats and changes in habitat area. We also investigated floral resource changes from the 1930s onward for England and Wales, based solely on changes in habitat coverage.
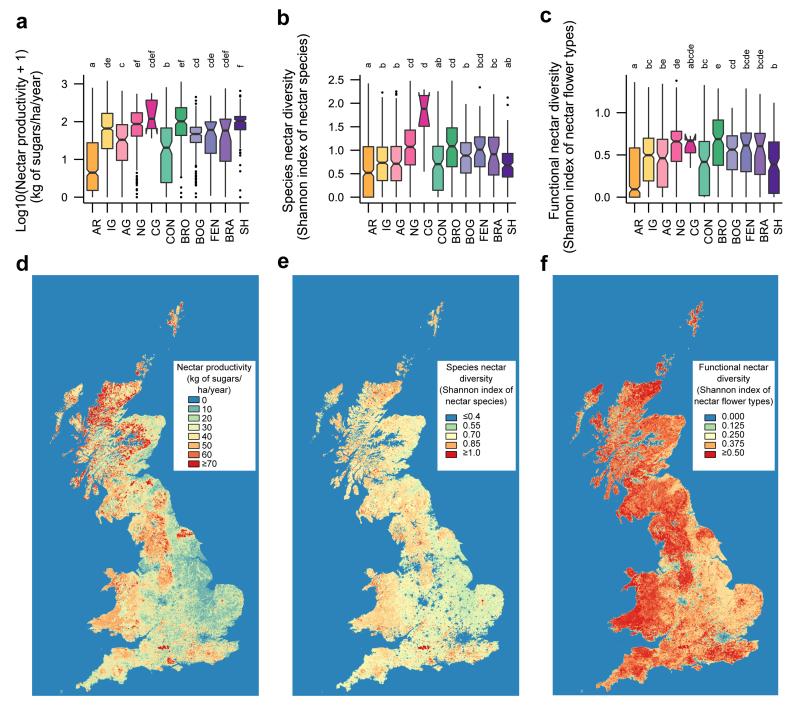
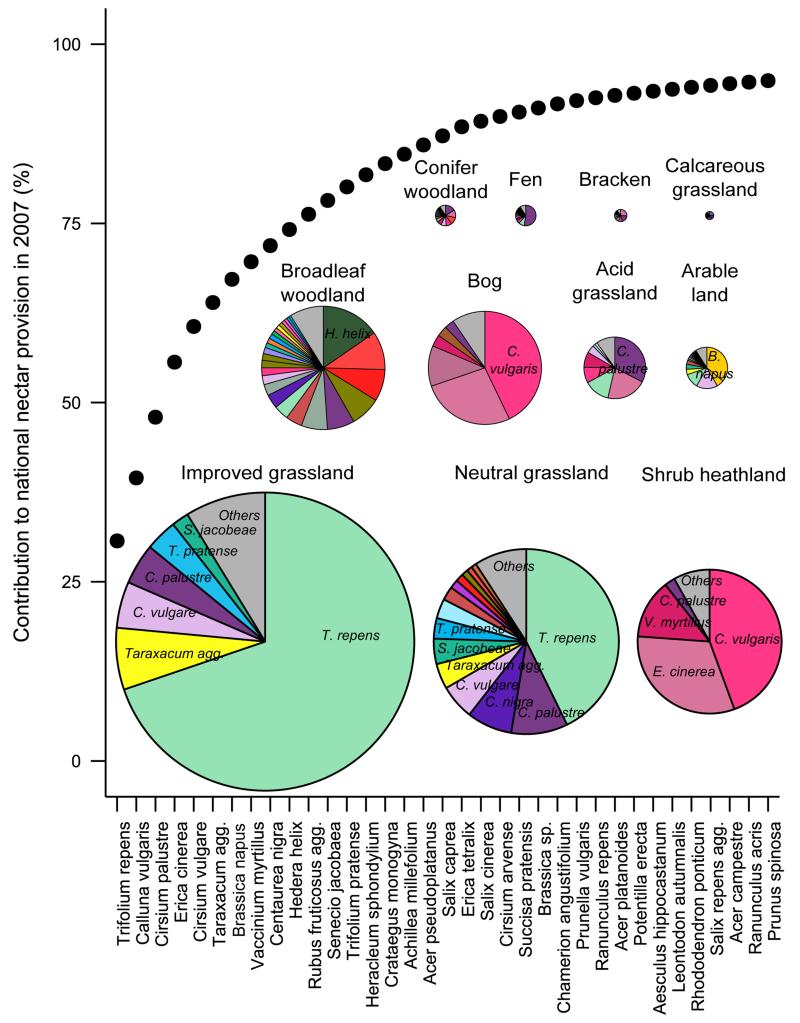
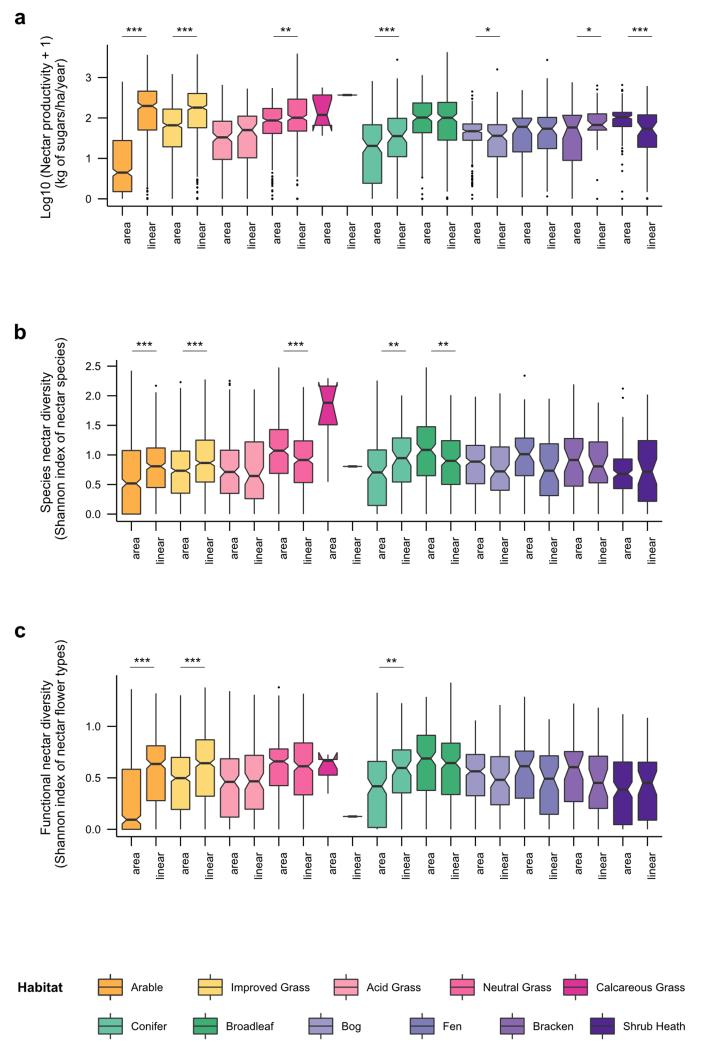
Considering the most recent Countryside Survey (2007), there are significant differences in annual nectar productivity, species nectar diversity and functional nectar diversity among habitats (Extended Data Table 1). Calcareous grassland, broadleaved woodland and neutral grassland are the best in all three respects (as well as shrub heathland for nectar productivity only) whereas arable land is consistently the poorest habitat (Supplementary Table 1). These habitat differences in nectar value create geographical variation in nectar productivity and diversity across Great Britain (Figure 1). After taking into account the national land cover of habitats, improved grassland contributed most (29%) to potential national nectar supply in 2007. Four species of plant, Trifolium repens, Calluna vulgaris, Cirsium palustre and Erica cinerea together produce over 50% of nectar nationally (see Extended Data Table 2 and Supplementary Result 1 for further information about these species and their pollinators), and 22 species produce over 90% (Figure 2). Other species may of course be important for pollen provision. Considering flowering phenology reveals seasonal variation nationally (Figure 3): 60% of nectar is provided in July/August when the flower density of British dominant species peaks. Because heathland species are unlikely to contribute as much in other European countries, this seasonal pattern may differ. The relative nectar value of linear features (hedgerows, watersides and road verges) depends on habitat. With the exception of those in shrub heathland and bog, linear features produce more nectar per unit area (and the contrast is particularly high in landscapes dominated by arable land, improved grassland and conifer woodland; Extended Data Figure 1). Of the five types of agri-environment scheme options we investigated, nectar flower mixtures have the highest nectar productivity value, followed by enhanced margins (Extended Data Table 3). Nectar flower mixture options are similar to hedgerows in term of annual nectar productivity per unit area, but they cover a much smaller area, and consequently contribute far less to the national nectar resources (0.1% of nectar supply comes from nectar flower mixtures compared to 3% from hedgerows in England, Extended Data Table 3).
Figure 1. Nectar productivity and diversity in Great Britain in 2007.
a, Box plots of log10 (x+1) nectar productivity (kg of sugars/ha/year) per habitat. b, Box plots of species nectar diversity (Shannon index of nectar species) per habitat. c, Box plots of functional nectar diversity (Shannon index of nectar flower types) per habitat. Box plots are based on 2007 vegetation data (see Supplementary Table 1 for sample sizes). Habitat types (AR=Arable land, IG=Improved grassland, AG=Acid grassland, NG=Neutral grassland, CG=Calcareous grassland, CON=Conifer woodland, BRO=Broadleaf woodland, BOG=Bog, FEN=Fen, BRA=Bracken, SH=Shrub heathland) significantly different from one another are indicated by different letters. d, Map of nectar productivity. e, Map of species nectar diversity. f, Map of functional nectar diversity. Maps are based on 2007 land cover and vegetation data.
Figure 2. Plant species’ contributions to Great Britain nectar provision and to habitat nectar provision, based on 2007 land cover and vegetation data.
The dotted line represents the cumulative contribution of plant species to the national nectar provision in 2007 (only species that contribute to the first 95% are shown). The pie charts represent the contribution of plant species towards nectar production in each habitat (only the species that contribute to the first 90% are shown) in 2007. The size of each pie chart is proportional to the contribution of each habitat to national nectar provision in 2007.
Figure 3. Seasonal nectar productivity in Great Britain, based on 2007 land cover and vegetation data.
Maps of nectar productivity in kg of sugars/ha from March to October (panels a to h). Hot colours correspond to high nectar productivity while cold colours correspond to low nectar productivity (see colours scale). Note that urban areas are assigned with nectar productivity values equal to zero, hence the blue colours in cities. Nectar productivity values for mapping correspond to back-transformed estimates of the linear mixed model fitted on log10 (x+1) nectar productivity of 2007 Countryside Survey non-linear plots with habitat, month and their interaction as fixed effects and plots nested within squares as random effects.
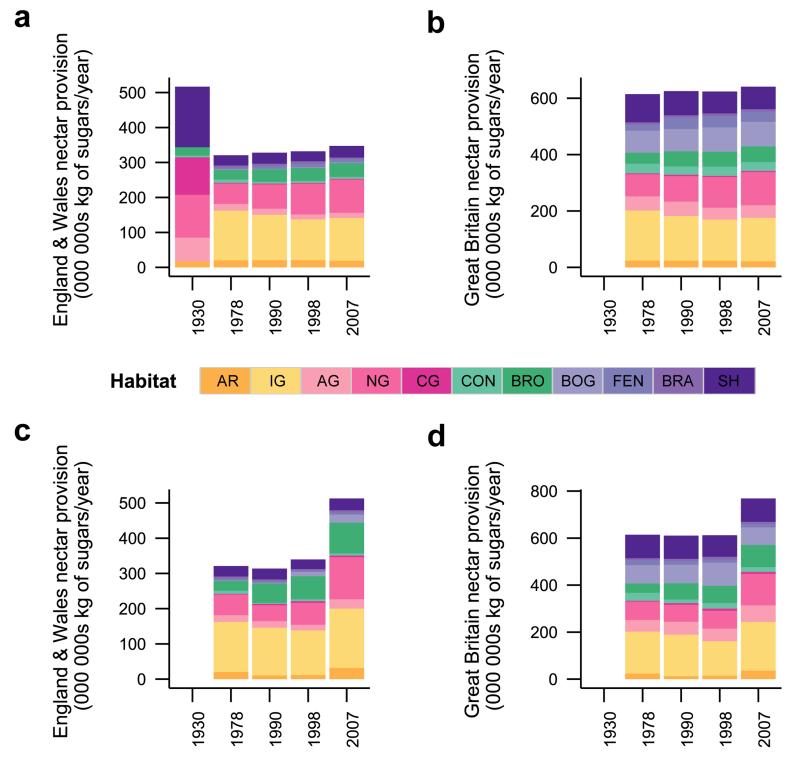
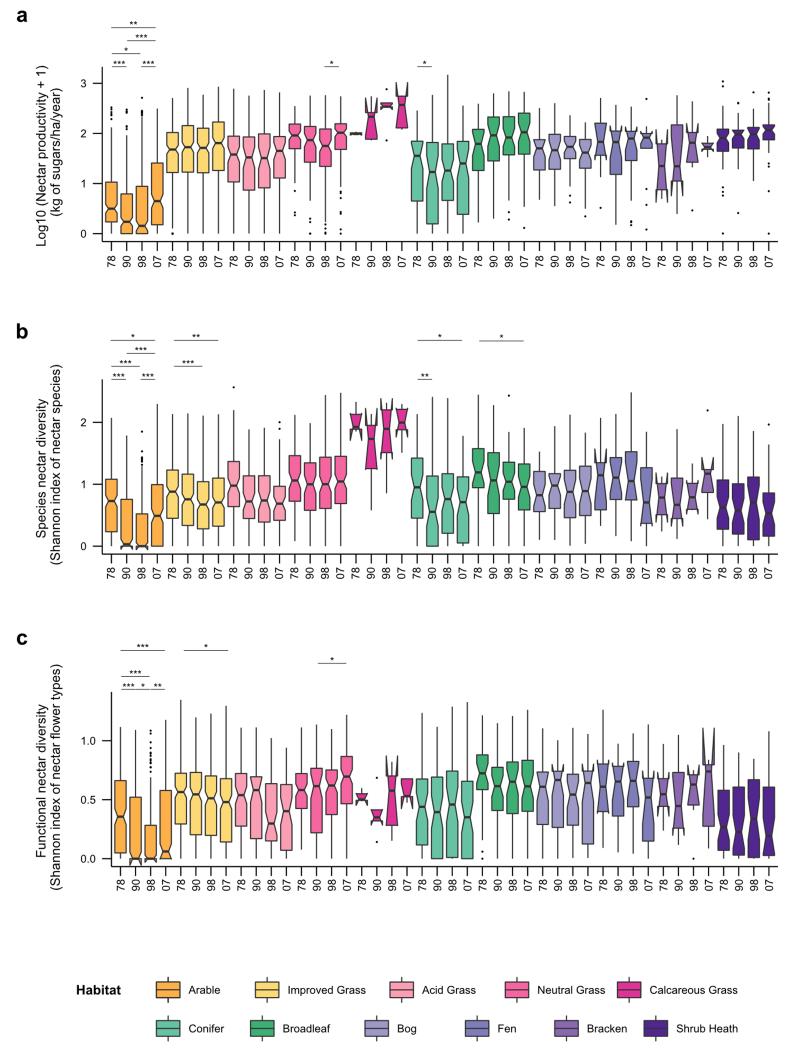
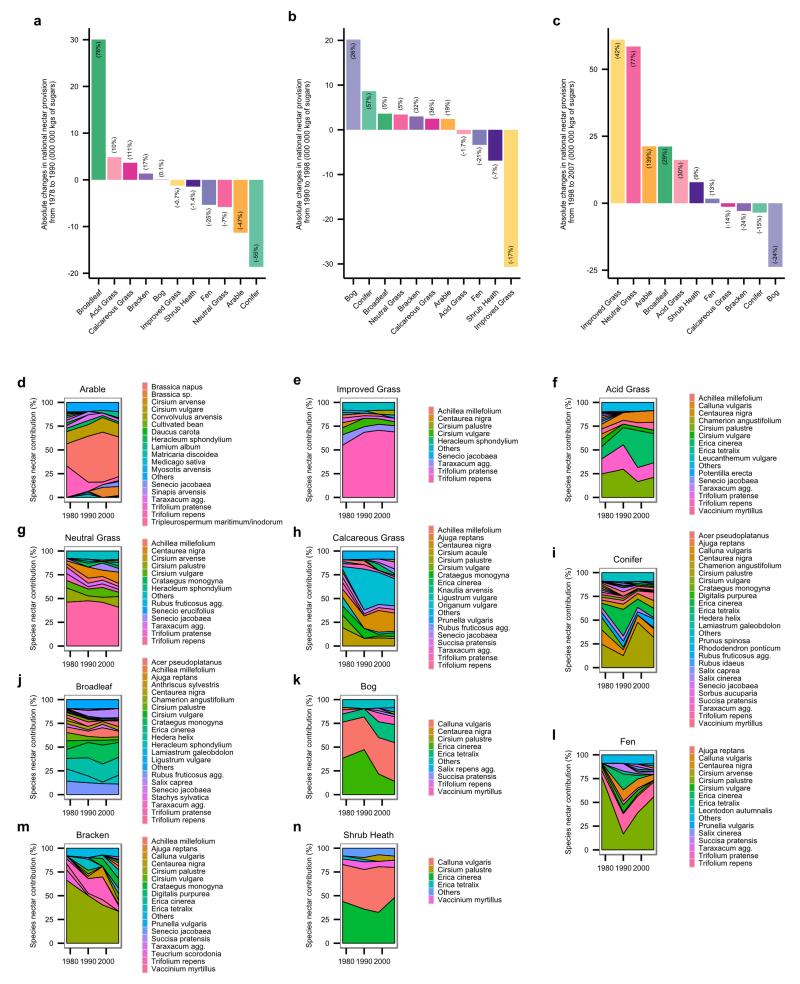
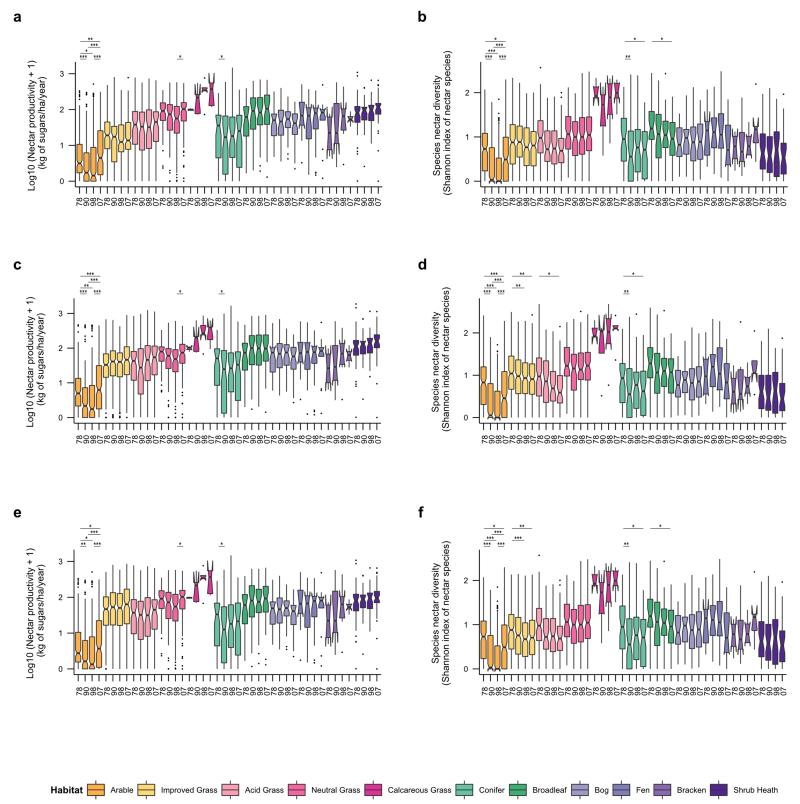
Historical shifts in nectar productivity, species nectar diversity and functional nectar diversity over recent decades depended on the habitat type and time period considered (Extended Data Table 1). From 1978 to 1990, annual nectar productivity decreased significantly in arable land and conifer woodland, but from 1990 to 1998, none of the habitats showed significant changes in nectar productivity. From 1998 to 2007, nectar productivity increased significantly in arable land and neutral grassland (Extended Data Figure 2). Nectar diversity, both at the level of plant species and functional groups decreased significantly in arable land and improved grassland from 1978 to 2007. Species nectar diversity also significantly decreased in conifer woodland and broadleaved woodland during that period. From 1978 to 1990, species nectar diversity declined in all habitats (except bog), significantly so in arable land and conifer woodland; thereafter it remained roughly constant, except in arable land where it rebounded somewhat from 1998 to 2007 (see Extended Data Figure 2 and Supplementary Results 2 for details on functional nectar diversity). For the 1930s we have information only on shifts in land cover (but not floral abundances within them), and only for England and Wales20. Assuming no change in floral composition within habitats, we found a strong decline in national nectar provision from 1930s to 1978 (−32%) followed by a period of stagnation from 1978 to 2007 (Figure 4, Supplementary Table 2). Incorporating shifts in nectar productivity within habitats for recent decades showed an increase in national nectar provision from 1998 to 2007 (+51% in England & Wales and +25% for Great Britain as a whole, Figure 4, Supplementary Table 3). While shifts in vegetation composition within dominant habitats predominate as causes of recent increases, no quantitative data are available before 1978. This recent upturn could be caused by decreased acidification21, decreased nitrogen deposition22 and agricultural set-asides23 during this period (Supplementary Table 4). However, post-war changes in habitat management (e.g. herbicide use in arable land, cessation of woodland coppicing, nitrogen deposition in grasslands; Supplementary Table 4) almost certainly resulted in lower nectar per unit area, suggesting that our estimates of losses based on land use change alone are conservative; actual resource declines may have been much larger than the recent increases (see Supplementary Discussion). Due to their large area, improved grassland provided the greatest contribution to the increase in national nectar provision from 1998 to 2007 (Extended Data Figure 3). After discounting the contribution of Trifolium repens in improved grasslands, as it may not flower in heavily grazed fields, the increase in nectar provision from 1998 to 2007 remained (Supplementary Result 3 and Extended Data Figure 4).
Figure 4. Historical changes in nectar provision (in kg of sugars/year) at the national scale in England & Wales (1930-2007) and in Great Britain (1978-2007).
Nectar provision partitioned by habitat, based on land cover for 1930 (England & Wales only), 1978, 1990, 1998 and 2007, using vegetation data from 1978 for all years (assuming unchanged nectar productivity within habitats across time) in a, England & Wales and b, Great Britain. Nectar provision partitioned by habitat, based on land cover and vegetation data for 1978, 1990, 1998 and 2007 in c, England & Wales and d, Great Britain. See Figure 1 for habitat type codes and Supplementary Table 5 for habitat land cover values.
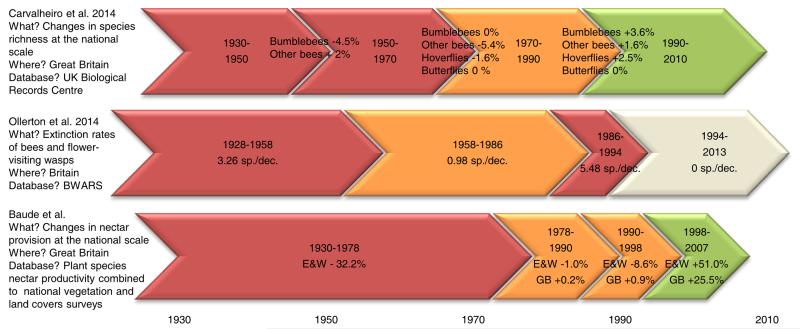
The historical pattern of change in nectar resources closely parallels documented shifts in pollinator communities (Extended Data Figure 5). Substantial declines in floral resources and their diversity in the mid to late 20th century, when agricultural intensification peaked, coincide with a period of heightened pollinator extinctions9. The stabilization and partial recovery of resources in recent decades corresponds to concomitant periods of decelerated declines and partial recovery in some pollinator groups10.
Our findings provide new evidence based on floral resources to support habitat conservation and restoration. First, we provide evidence of the high nectar value of calcareous grassland for pollinating insects. Calcareous grassland area has declined drastically in Great Britain and only a small fraction of the historical national cover remained by 200713,14. Second, the low availability and diversity of nectar sources in arable habitats highlights the need to provide supplementary resources to support pollination services in farmlands, especially as the use of insect-pollinated crops has increased nationally24 and globally25. The conservation and restoration of broadleaf woodland and neutral grassland as components of the farmland matrix could help to support diverse flower-visiting insect communities in arable land. The contrast in nectar productivity between linear features and the surrounding vegetation is particularly high in arable land, suggesting that linear features, especially hedgerows, provide an efficient means to enhance floral resources in farmlands if they are managed appropriately to allow flowering26. While agri-environment options such as nectar flower mixtures can also enhance the supply of floral resources locally, their contribution to nectar provision nationally remains low. The higher profile given to floral resource provision in the revised Countryside Stewardship guidelines for England16 may substantially enhance resources in future. Finally, our results indicate that improved grassland has the potential to contribute massively to the nectar available nationally. Small adjustments to the management cycle in improved grasslands, allowing white clover, the dominant resource species, to flower, would help realize this potential, although its utility might be restricted to a limited number of pollinator species (Extended Data Table 2). Together, our results on the nectar values of the commonest British plants and the historical changes in plant communities provide the evidence base needed to understand recent national changes in nectar provision and identify the management options needed to restore national nectar supplies.
Methods
Stage 1: Constructing the nectar database by scaling up nectar resources from the flower to the vegetative scale
Identifying the key plant species to be sampled
While there are >2800 plant species in Great Britain27, only 1341 of them are common enough to have been encountered in the Countryside Survey. Of these, the 454 commonest species accounted for 99% of national plant cover in 2007. More than half of these 454 species are unrewarding to pollinators (mainly bryophytes, pteridophytes, gymnosperms and wind-pollinated angiosperms28), leaving 220 species that are likely to contribute substantially to floral resources at a national scale. We focus here on these 220 species, along with an additional 50 species that we believe to be locally important floral sources (e.g. Buddleja davidii, Impatiens glandulifera, Knautia arvensis). Together, these 270 plant species provide a focal set of potential importance in national nectar provision (Supplementary Table 11).
Quantifying nectar productivity empirically: the ‘surveyed species’
Of the 270 species, 175 were surveyed in the field from February 2011 to October 2012, mainly in the South of England. When possible (112 species), nectar was collected from plants in at least two populations in two locations. For three species (Caltha palustris, Lamium purpureum, and Sinapis arvensis), half the nectar samples, and for Viola arvensis all the samples were collected from pot-grown plants, because insufficient flowering field populations were found. For the remaining species, nectar was collected from plants in one field population. When possible, the different populations were sampled on different dates, thus providing some measure of variation due to differences in location and weather. Note that nectar was collected in only 1-2 sites per species, and so intraspecific variation in production per flower was not assessed (but see Supplementary Result 4).
Nectar was collected from ten single flowers in each population between 0900-1600 hours (median: 20 and range: 5-30 flowers collected per species in total; see Extended Data Figure 6 and Supplementary Result 4 for site correlation); these had been bagged (using 1.4 × 1.7mm fabric mesh) for 24h to prevent depletion by nectar-feeding insects. When possible (76 species), glass microcapillaries (1 and 5μL Minicaps, Hirshmann, Eberstadt, Germany) were used directly to collect the nectar, otherwise single flowers were rinsed twice with 1-5 μL of distilled water added to the nectaries with a pipette for one minute, and the diluted nectar solution was collected. The sugar concentration of nectar (%; g sucrose/100 g solution) was measured by using a hand held refractometer modified for small volumes (Eclipse, Bellingham and Stanley, Tunbridge Wells, UK). The amount of sugar produced per flower basis over 24h (s; μg of sugars/flower/24h) was calculated using the formula29
where v is the volume collected (μL), and d is the density of a sucrose solution at a concentration C (g sucrose/100 g solution) as read on the refractometer. The density of the sucrose solution was calculated by the formula29
The number of open flowers per unit area of vegetative cover (flower density) was estimated for 179 species by placing five quadrats (0.5m × 0.5m) haphazardly on each flowering population (median: 10 quadrats, range: 1-20 quadrats; see Extended Data Figure 6 and Supplementary Result 4 for site correlation). In each quadrat, we counted the number of open floral units of the focal species (a “floral unit” is one or multiple flowers that can be visited by insects without flying30; for example a composite flowerhead of daisy, Bellis perennis). We also counted the number of open flowers present in one typical open floral unit in each quadrat. Vegetative cover for each plant species was estimated using a point-quadrat approach with the cross-strings of the quadrat: cover was expressed as proportional to the number of the 36 cross-points covered by the foliage of the species of interest in each quadrat. For trees, instead of using quadrats, we counted the number of floral units in a 3D cube (0.5 × 0.5 × 0.5m) that was placed in the outer areas of foliage. This was extrapolated to the whole column situated above the unit of vegetative cover by measuring the height of tree foliage with an inclinometer (PM-5/360 PC Suunto) and by estimating the distribution of the flowers within the tree foliage (subjectively assessed scores: from 1 for a strongly biased flower distribution on the outer edges of the foliage to 5 for a homogeneous full flower distribution). Given that flower density is not constant throughout the flowering season, we estimated variations in flower density according to a triangular function from the estimated peak of flowering through the flowering season which was documented from recorded phenologies28,31,32 (see Supplementary Method 1 and Extended Data Figure 6 for phenology parameter relationships). An alternative nectar rectangular phenology productivity database was also generated by keeping nectar productivity of each species constant throughout the flowering season; this was used to perform sensitivity analyses.
The mean nectar sugar content from a single flower (produced over a 24h period) was multiplied up to the nectar content of a single floral unit (number of flowers in a floral unit), then to the amount of nectar per unit area (number of flowers per m2), to the amount of nectar per unit area for each month (variation in flower density over the flowering season) and finally to the amount of nectar per unit area per year. Despite relatively low sample sizes per species compared to species-specific studies, our estimates of sugar production were well correlated with published values both per flower/day and per area/year (Extended Data Figure 6 and Supplementary Result 4). This empirical method provided the nectar productivity values for 161 plant species amongst the 175 initially surveyed (nectar productivity could not be scaled up for some species due to mismatches with phenological data, see Supplementary Method 1).
Modelling nectar productivity: the ‘unsurveyed species’
To model the nectar productivity of the plant species that could not be surveyed in the field, we used a predictive modelling approach. We first analysed variation in the nectar values from the surveyed species. A linear model was fitted to annual nectar sugar productivity (log10 (x+1) transformed) as a function of plant traits. Plants traits were mainly collected from the BiolFlor database33, and included: “flower shape”, “breeding system”, “life span”, the degree of “dicliny”, the maximum “height”, the “flowering period” and “family” (see Supplementary Method 2 for definitions). The estimates from the most parsimonious statistical model based on AIC criterion (Supplementary Table 6, N=153; Adjusted r2=0.55) were used to predict the annual nectar sugar productivity for the initial list of surveyed and unsurveyed species on the basis of their traits. To check the validity of the predicted values, we adopted a repeated “leave-one-out” approach to model successively all the excluded values from the empirically derived datasets. Then, we applied a standardized major axis regression on the log10 (x+1) transformed empirically derived and modelled nectar values of the surveyed species (Extended Data Figure 6). We predicted the nectar values for 252 species; and giving priority to empirical and default values, we included 94 of them in our database. An alternative nectar productivity database was also generated by considering only the species with empirical nectar values; this was used to perform sensitivity testing.
Ascribing default values for nectar productivity
For four crop species harvested before flowering; onion (Allium cepa), cabbage (Brassica oleracea cultivated), turnip (Brassica rapa) and radish (Raphanus sativus) we assigned a value of zero for nectar productivity. A zero-value was also assigned to Helianthemum nummularium, despite the missing flower density data, given that we collected no nectar in flowers. In the Countryside Survey vegetation dataset, some taxa are only identified at the genus level; we interpreted these taxa to represent the commonest species in the genus (e.g. Centaurea sp. was interpreted as Centaurea nigra). For 10 species out of the initial list of 270 it was not possible to quantify nectar production, leading to a total of 260 species with quantified annual and monthly nectar productivity values (161 values from empirical research, 94 modelled values, and 5 default values, Supplementary Table 11). All the above steps of scaling-up process are summarized in Supplementary Table 7.
Stage 2: Using the Countryside Survey vegetation database to scale up nectar resources from plant species to communities at the habitat and national scales
Spatio-temporal variations in nectar provision at the national scale were calculated by combining our nectar productivity dataset with vegetation and land cover data already recorded during the Countryside Survey19. The Countryside Survey is a national survey of plant communities conducted in 1978, 1990, 1998 and 2007 in Great Britain (England, Wales and Scotland). The survey was conducted by selecting 1-km sample squares at random from 32 Land Classes19 representing physiographically similar sampling domains throughout Great Britain, ensuring an unbiased representation of the British non-urban landscape. Within each square, a random, stratified sample of five areal (non-linear) square plots (200 m2) was established and the presence and the percentage cover of all vascular plant species were recorded. These plots were classified to 17 habitat classes, but we only used data from 11 habitats: acid grassland, arable land, bog, bracken, broadleaf woodland, calcareous grassland, conifer, fen, improved grassland, neutral grassland and shrub heath (Supplementary Table 8 for habitat description). The habitats not used were inland rock, littoral rock/supralittoral rock, littoral sediment/supralittoral sediment, montane and urban habitats; these were excluded due to low sample sizes. Even though urban habitats probably contribute to the national nectar provision, we were unable to include this habitat in this study because the Countryside Survey was not designed to survey urban areas. In 1.14% of Countryside Survey plots, two or more habitats were attributed to the same plot; these were excluded for this study. Additional plots were used to sample linear features in each 1km square, covering hedgerows, streamsides and road verges (1×10m and oriented along the linear feature). Each linear plot was also attributed to its nearest adjacent habitat.
To investigate the most recent nectar patterns, we used the most comprehensive vegetation dataset from the Countryside Survey 2007 that encompasses all non-linear plots (2576 plots in 2007). To focus on linear features, we included vegetation data from linear features plots (1951 plots in 2007). To test for historical changes from 1978 to 2007, we used vegetation data from non-linear plots shared between the 1978, 1990, 1998 and 2007 Countryside Surveys (529 shared plots in England & Wales and 768 in Great Britain; Supplementary Table 9). We focussed on the shared plots across years because the Countryside Survey sampling design was modified over time (e.g., from fixed to proportional plot number per Land Class from 1978 to 1990).
The annual nectar productivity within each plot (kg/ha/year) is the sum of the nectar productivity of each species (kg/ha cover/year) weighted by their vegetative cover in the plot (%), assuming that the vegetative cover is representative of floral abundance (see Extended Data Figure 7 and Supplementary Results 4 for details). Nectar productivity values of plots were used to statistically estimate the annual nectar productivity for each habitat (kg/ha/year). The annual nectar provision of each habitat (kg/year) was computed from their annual habitat nectar productivity (kg/ha/year) multiplied by their respective national land covers for each survey (areas of habitats in ha from Countryside Surveys19,34,35; Supplementary Table 5). These were summed to estimate the annual national nectar provision in 1978, 1990, 1998 and 2007. For the 1930s period, areas of habitats (only available for England and Wales) were derived from the digitalised Dudley Stamp land utilisation survey maps20; see Supplementary Method 3 and Supplementary Table 5). Because nectar productivity can’t be assessed for this period, we quantified nectar provision in 1930, 1978, 1990, 1998 and 2007 assuming unchanged nectar productivity within habitats but using observed shifts in land cover among habitats across time. The national nectar provision of hedgerows was calculated from their mean nectar productivity (kg/ha/year) multiplied by their estimated area in England (length of hedgerows from Countryside Survey 2007 for England35, assuming a 1m width).
The contribution of habitat or species to the national nectar provision in 2007 is the fraction of nectar provided by these entities (in %). The amount of nectar offered by each habitat in 2007 is calculated from habitat nectar productivity (estimated value of habitat productivity) multiplied by its national area. The amount of nectar offered by each species in 2007 is calculated from the sum of its average nectar productivity stratified by habitat and multiplied by habitat national area. The contribution of habitat or species to the historical changes in national nectar provision is expressed by the absolute change (in kg of sugars), which is the difference in the amount of nectar produced by the entity during the time period considered. Relative change (in %) which is the absolute change multiplied by 100 and divided by the amount of nectar produced at the initial date, refers to the magnitude of change for each entity.
Nectar diversity was estimated through two Shannon indexes (using ‘vegan’ package in R36) that encompass both the richness and the evenness of nectar producing sources (see Supplementary Method 4). The species nectar diversity index, based on the proportion of nectar produced by each species, was calculated as follows:
where pi is the proportional nectar contribution of plant species i and S is the total number of plant species in each plot.
The functional nectar diversity index, based on the proportion of nectar produced by each floral morphology group, reflects the diversity of nectar sources in terms of resource accessibility for flower-visiting insects. Flower types were derived from Müller flower classification system recorded from the BiolFlor database33 which was condensed into five classes: pollen rewarding flowers, open, partly-hidden, hidden, and bee flowers (see Supplementary Method 4). The functional nectar diversity index was computed as follows:
where pi is the proportional nectar contribution of flower type i and S is the total number of flower types in each plot.
The annual nectar productivity (kg of sugars/ha/year), species nectar diversity (Shannon index of nectar contribution of plant species) and functional nectar diversity (Shannon index of nectar contribution of floral morphology groups) in 2007 were mapped at the British national scale using the Great Britain Land Cover Maps of 200737.
Stage 3: Using Agri-environment scheme flower abundance data to estimate nectar provision within agri-environment scheme options at the national scale
Various options are available for managing habitats to provide floral resources for pollinators, some of which are eligible for grant aid under European Union funded agri-environment schemes. Agri-environment options within the English ‘Environmental Stewardship’ scheme included sowing nectar flower mixtures (EF4/HF4), sowing wild bird seed mixtures (EF2/HF2), creation or enhancement of floristically-enhanced buffer strips (HE10), re-introduction or continuation of haymaking (haymaking supplement HK18) and creation, restoration and maintenance of species-rich semi-natural grassland (HK6/7/8). These five options were selected as the most likely to provide floral resources for pollinators.
Field study sites were located on farmland and nature reserves in which the following replicates of the pollinator habitats were present: nectar flower mixtures (n=32), wild bird seed mixtures (n=4), enhanced field margins/road verges (n=7), hay meadows (n=5) and species-rich grasslands (n=7). These were existing habitats representing ongoing management by the land owners or land managers concerned. Transects 100m long × 6m wide were established in each habitat. The number of floral units of each flowering species was recorded on 1 to 3 occasions, in 20 × 1m2 quadrats per transect. Annual nectar productivity (kg of sugars/ha/year) was calculated for each species at each site from the average estimated nectar productivity at the peak of the flowering season derived from the several counts of floral units across the flowering period (analogous to Supplementary Method 1). The values for the species present in each habitat were then summed to estimate productivity for each habitat.
National areas of options providing floral resources in the English agri-environment scheme “Environmental Stewardship” were extracted for 2007 for England (data for Great Britain was unavailable) from data supplied by Natural England38,39. Mean nectar productivity per unit area was multiplied by the national area of each option to give nectar provision by that option (kg of sugars/year). The total contribution of nectar provision provided by Environmental Stewardship in England is a minimum value, as it has been compared to national provision estimated from vegetative cover rather than direct flower counts and we did not take into account the more limited floral resources potentially provided by other options.
Stage 4: Statistical analyses
Statistical analyses were carried out with Linear Mixed-Effect Models (lme function from ‘nlme’ package) in R 3.0.1(36). To investigate the most recent nectar variations (2007), we analysed the log10(x+1) annual nectar productivity, species nectar diversity and functional nectar diversity according to the type of habitat (“HABITAT”; 11 habitats) of the non-linear plots. The differences in log10(x+1) nectar productivity, species nectar diversity and functional nectar diversity between non-linear and linear features were analysed according to the type of habitat (“HABITAT”; 11 habitats), the type of vegetation surveyed (“TYPE”; non-linear vs linear features) and the interaction between these two terms. Countryside Survey square (“SQUARE”) was included as a random term in these models in order to account for the spatial auto-correlation of plots nested into 1km squares. In order to investigate historical changes over recent decades (1978-2007), we analysed the log10(x+1) annual nectar productivity, species nectar diversity and functional nectar diversity computed from the shared non-linear plots in 1978, 1990, 1998 and 2007 according to the type of habitat (“HABITAT”), the year (“YEAR”) considered as a categorical factor, and the interaction between these two terms. We included plots nested within square (“SQUARE/PLOTS”) as random terms to account for the spatial and temporal autocorrelation of the data in this latter model. This latter statistical test was repeated considering all shared plots in Great Britain or only those in England & Wales to provide estimates of habitat nectar productivity across time for distinct areas, allowing comparisons with earlier (1930s) habitat information only available for that latter area. Significant differences among modalities were analysed with multiple comparisons (single-step method adjusted p-values from glht function in “multcomp” package in R36). Model residuals were plotted to visually check that normality and homoscedasticity assumptions were satisfied. We re-ran the same analyses with the Countryside Survey vegetation data combined with (i) the alternative nectar rectangular phenology productivity database (created by keeping constant nectar productivity of each species during the flowering season); and (ii) using only the empirical nectar productivity database, as sensitivity tests (Extended Data Figure 4, Supplementary Result 3). Plots were performed with ggplot2 package in R36. All box plots show the median, 25th and 75th percentiles (lower and upper hinges), trimmed ranges that extend from the hinges to the lowest and highest values within 1.5 × inter-quartile range of the hinge (lower and upper whiskers) plus outliers (filled circles). Notches that extend 1.58 × inter-quartile range / square root of the number of observations were represented to give a roughly 95 interval for comparing medians.
Extended Data
Extended Data Table 1. ANOVA results for annual nectar productivity, species nectar diversity and functional nectar diversity.
a, 2007 values according to habitat. The linear mixed effect models were performed on data from 2576 non-linear plots surveyed in 2007. b, 2007 values according to habitat and location. The linear mixed effect models were performed on data from 4527 plots (2576 non-linear plots and 1951 linear plots) surveyed in 2007. c, 1978-2007 values according to habitat and year. The linear mixed effect models were performed on data from 768 shared plots surveyed in 1978, 1990, 1998 and 2007. The annual nectar productivity was systematically log10 (x+1) transformed. See Supplementary Table 1 and Supplementary Table 3 for sample sizes.
|
a
| ||||
|---|---|---|---|---|
| Response variable | Effect | df | F value | P-value |
| Nectar productivity | Habitat | 10 | 69.643 | <.0001 |
| Species nectar diversity | Habitat | 10 | 19.923 | <.0001 |
| Functional nectar diversity | Habitat | 10 | 24.150 | <.0001 |
|
b
| ||||
|---|---|---|---|---|
| Response variable | Effect | df | F value | P-value |
| Nectar productivity | Habitat | 10 | 75.081 | <.0001 |
| Location | 1 | 0.560 | 0.455 | |
| Habitat:Location | 10 | 63.519 | <.0001 | |
| Species nectar diversity | Habitat | 10 | 22.061 | <.0001 |
| Location | 1 | 0.147 | 0.701 | |
| Habitat:Location | 10 | 10.396 | <.0001 | |
| Functional nectar diversity | Habitat | 10 | 23.677 | <.0001 |
| Location | 1 | 2.158 | 0.142 | |
| Habitat:Location | 10 | 15.810 | <.0001 | |
|
c
| ||||
|---|---|---|---|---|
| Response variable | Effect | df | F value | P-value |
| Nectar productivity | Habitat | 10 | 26.860 | <.0001 |
| Year | 3 | 1.473 | 0.220 | |
| Habitat:Year | 30 | 1.793 | 0.005 | |
| Species nectar diversity | Habitat | 10 | 5.137 | <.0001 |
| Year | 3 | 2.600 | 0.050 | |
| Habitat:Year | 30 | 2.523 | <.0001 | |
| Functional nectar diversity | Habitat | 10 | 3.517 | 0.0001 |
| Year | 3 | 1.987 | 0.114 | |
| Habitat:Year | 30 | 1.725 | 0.009 | |
Extended Data Table 2. Flower morphology and flower-visiting insects of the four main nectar providing species.
Flower morphology parameters (mean and standard error for depth and width of flower tubes) were measured on 20-40 flowers per species in the field. Flower-visiting insects were listed from published and unpublished plant-insect visiting networks from Memmott’s group to which recorded interactions from a review of literature have been added (see Supplementary Table 12 for reference list).
| Depth of nectar tube |
Width of nectar tube |
Number of visiting insect species | Frequent visiting insect species | Number of sources |
|||||||
|---|---|---|---|---|---|---|---|---|---|---|---|
| mean | sem | mean | sem | All | Diptera | Hymeno | Lepido | Coleo | |||
| Trifolium repens | 4.84 | 0.19 | 1.36 | 0.04 | 54 | 22 | 16 (13 species of Bombus) |
8 | 8 |
Bombus pascuorum, Bombus lucorum/terrestris, Bombus lapidarius |
21 |
| Calluna vulgaris | 2.23 | 0.10 | 1.93 | 0.07 | 139 | 96 | 29 (9 species of Bombus) |
13 | 1 |
Bombus lucorum/terrestris, Bombus pascuorum, Apis mellifera, Bombus jonellus |
9 |
| Cirsium palustre | 3.63 | 0.07 | 1.42 | 0.07 | 12 | 5 | 7 (6 species of Bombus) |
0 | 0 |
Bombus pascuorum, Bombus lucorum/terrestris, Bombus pratorum |
6 |
| Erica cinerea | 5.81 | 0.11 | 1.67 | 0.06 | 49 | 19 | 27 (10 species of Bombus) |
2 | 1 |
Bombus jonellus, Bombus lucorum/terrestris, Bombus pascorum |
6 |
Extended Data Table 3. Agri-environment schemes and linear features: nectar productivity and provision in England in 2007.
a, Mean nectar productivity values of agri-environment schemes were estimated from our nectar productivity database combined with flower counts in these options. Areas of options providing floral resources in the English agri-environment scheme “Environmental Stewardship” were extracted for 2007 from data supplied by Natural England38,39. b, Mean nectar productivity values of linear features correspond to back-transformed (10^x – 1) estimates of the linear mixed model fitted on log10 (x+1) nectar productivity of all Countryside Survey linear plots surveyed in England in 2007. National areas of hedgerows were estimated from the length given in Countryside Survey 2007 for England35 and assuming a 1m width.
|
a
| ||||
|---|---|---|---|---|
| Option | Option code | Mean nectar productivity (kg of sugars/ha/year) |
England land cover (000s ha) |
England nectar provision (000 000s kg of sugars/year) |
| Wild bird seed mixture | EF2/HF2 | 56.00 | 2.97 | 0.17 |
| Enhanced grass buffer strip | HE10 | 166.80 | 0.62 | 0.10 |
| Nectar flower mixture | HF4/HF4 | 244.00 | 1.61 | 0.39 |
| Haymaking supplement | HK18 | 18.60 | 1.12 | 0.02 |
| Species-rich semi-natural grassland | HK6/7/8 | 31.90 | 2.77 | 0.09 |
|
b
| ||||
|---|---|---|---|---|
| Linear features | Linear code | England mean nectar productivity (kg of sugars/ha/year) |
England land cover (000s ha) |
England nectar provision (000 000s kg of sugars/year) |
| Hedgerows | H | 341.59 | 40.20 | 13.73 |
| Watersides | S | 60.97 | / | / |
| Road verges | R | 60.63 | / | / |
Extended Data Figure 1. Annual nectar productivity and diversity in linear features in 2007.
a, Box plots of log10 (x+1) nectar productivity according to the location of the vegetation surveyed (non-linear vs linear features) in each habitat. b, Box plots of species nectar diversity according to the location of the vegetation surveyed (non-linear vs linear features) in each habitat. c, Box plots of functional nectar diversity according to the location of the vegetation surveyed (non-linear vs linear features) in each habitat. Significant differences of locations (linear vs nonlinear) in habitats are indicated by asterisks as follows: * for p ≤ 0.05; ** for p ≤ 0.01; *** for p ≤ 0.001. Statistical model were re-run without calcareous grassland habitat (to meet residuals homoscedasticity constraint) in order to check that significant effects remained. See Extended Data Table 1 for ANOVA results.
Extended Data Figure 2. Historical changes in nectar productivity and diversity per habitat over recent decades (1978 to 2007).
a, Box plots of log 10 (x+1) nectar productivity per habitat, based on vegetation data for 1978, 1990, 1998 and 2007. b, Box plots of species nectar diversity per habitat, based on vegetation data for 1978, 1990, 1998 and 2007. c, Box plots of functional nectar diversity per habitat, based on vegetation data for 1978, 1990, 1998 and 2007. Significant differences of time periods per habitats are indicated by stars (* for p ≤ 0.05; ** for p ≤ 0.01; *** for p ≤ 0.001). See Extended Data Table 1 for ANOVA results.
Extended Data Figure 3. Habitat contributions to the national nectar provision shifts and species contributions to habitats over recent decades (1978 to 2007).
Habitat contributions to the national nectar provision changes from a, 1978 to 1990 b, 1990 to 1998 and c, 1998 to 2007. All barplots represent the absolute changes (in 000 000 kg of sugars) for each habitat during the time period considered. Numbers in brackets indicate the relative changes (in %). Species contributions to nectar provision in 1978, 1990, 1998 and 2007 per habitat type (panels d-n). Only species that contribute to the first 90% are shown. See Supplementary Table 10 for main contributing species to the national changes from 1978 to 2007.
Extended Data Figure 4. Sensitivity analyses of historical trends from 1978 to 2007 in nectar productivity and species diversity with alternative datasets.
a, Box plots of log 10 (x+1) nectar productivity and b, Box plots of species nectar diversity per habitat based on vegetation data for 1978, 1990, 1998 and 2007 discounting the contribution of grazed white clover in improved grassland. c, Box plots of log 10 (x+1) nectar productivity and d, Box plots of species nectar diversity per habitat, based on vegetation data for 1978, 1990, 1998 and 2007 and computed with the alternative rectangular phenology function. e, Box plots of log 10 (x+1) nectar productivity and f, Box plots of species nectar diversity per habitat, based on vegetation data for 1978, 1990, 1998 and 2007 and computed considering only the species with empirical nectar values. Significant differences of time periods per habitats are indicated by stars (* for p ≤ 0.05; ** for p ≤ 0.01; *** for p ≤ 0.001). See Supplementary Table 3 for sample sizes and Supplementary Result 3 for details.
Extended Data Figure 5. Historical timeline in changes in nectar resources and flower-visiting insects in Great Britain.
Historical periods with the greatest negative changes in nectar resources and flower-visiting insects are indicated in red, those with intermediate changes are in orange and those with the lowest (or even reversing) changes are in green. Main historical trends from this study (Baude et al.) are presented in regard to those described in Carvalheiro et al. 201410 and Ollerton et al. 20149 studies. The white chevron indicates a provisional extinction rate that needs to be confirmed on a 20 year period of time (see supplementary materials from Ollerton et al. 20149).
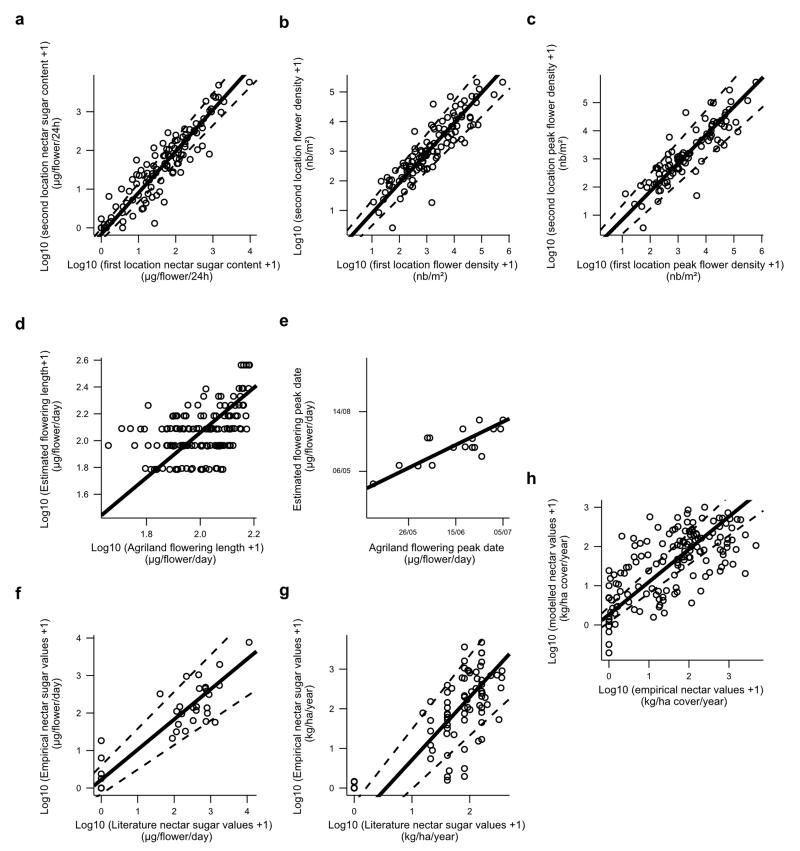
Extended Data Figure 6. Validity of the datasets.
a, Major axis linear regression of log10 (x+1) nectar values per flower obtained in the second location against those obtained in the first one. b, Major axis linear regression of log10 (x+1) flower density values obtained in the second location against those obtained in the first one. c, Major axis linear regression of log10 (x+1) peak flower density values obtained in the second location against those obtained in the first one. d, Standardized major axis regression of the log(x+1) length of the flowering period used for analyses with those derived from IPI AgriLand floral transects (unpublished data). e, Standardized major axis regression of peak date of flowering season used for analyses with those derived from IPI AgriLand floral transects (unpublished data). f, Major axis linear regression performed on the log10 (x+1) empirical (empirical dataset) and published nectar values (literature dataset from Raine & Chittka 200740) at the flower scale. g, Standardized major axis linear regression performed on the log10 (x+1) empirical (empirical dataset) and published nectar values (literature dataset, see Supplementary Table 13 for references) at the vegetative scale. h, Standardized major axis linear regression performed on the log10 (x+1) empirical and modelled nectar values generated by a leave-one-out approach. Estimates of all equations are derived from (standardized) major axis regression (ma and sma function from ‘smatr’ package in R36; see Supplementary Result 4 for details).
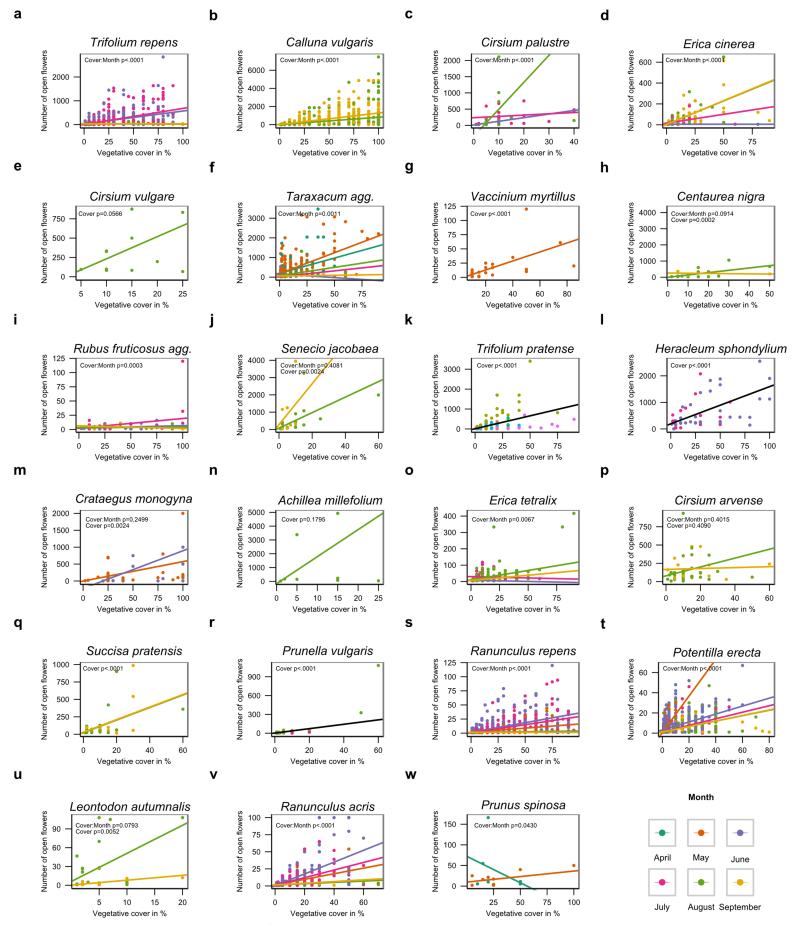
Extended Data Figure 7. Flower number and vegetative cover relationships.
Linear regressions between the number of open flowers counted in a quadrat of 0.5m2 according to the vegetative cover of the focus species in the quadrat (in %). Data are extracted from IPI AgriLand floral transects survey in 2012 (unpublished data) for 23 out of the 35 main nectar contributing species (panels a-w). The number of flowers was analyzed according to the vegetative cover (“Cover”), the month of the survey (“Month”) and the interaction between these two terms (“Cover:Month”) using negative binomial generalized linear models (see Supplementary Result 4 for details). Colored lines represent the linear regression between flower abundance and vegetative cover for each month of the survey. Black lines represent the overall linear regression between flower abundance and vegetative cover when the “Month” covariate cannot be included in the model. Line equations were derived from statistical intercept and slope estimates.
Supplementary Material
Acknowledgments
This research was supported by the UK Insect Pollinators Initiative (IPI) “AgriLand: Linking agriculture and land use change to pollinator populations” project, funded by the Biotechnology and Biological Sciences Research Council (BBSRC), Wellcome Trust, Scottish Government, Department of Environment, Food and Rural Affairs (DEFRA) and Natural Environment Research Council (NERC) under the auspices of the Living with Environmental Change partnership: grant BB/H014934/1 (www.agriland.leeds.ac.uk). Land Cover and Countryside Survey data are owned by NERC – Centre for Ecology & Hydrology (www.countrysidesurvey.org.uk).
Footnotes
Supplementary Information is available in the online version of the paper.
The floral resource database will be made available from the NERC Environmental Information Data Centre (doi:10.5285/69402002-1676-4de9-a04e-d17e827db93c and doi:10.5285/6c6d3844-e95a-4f84-a12e-65be4731e934).
The authors declare no competing financial interests.
References
- 1.Biesmeijer J, et al. Parallel declines in pollinators and insect-pollinated plants in Britain and the Netherlands. Science. 2006;313:351–354. doi: 10.1126/science.1127863. [DOI] [PubMed] [Google Scholar]
- 2.Potts SG, et al. Global pollinator declines: trends, impacts and drivers. Trends Ecol. Evol. 2010;25:345–353. doi: 10.1016/j.tree.2010.01.007. [DOI] [PubMed] [Google Scholar]
- 3.Vanbergen AJ, the Insect Pollinators Initiative Threats to an ecosystem service: pressures on pollinators. Front. Ecol. Environ. 2013;11:251–259. [Google Scholar]
- 4.Goulson D, Nicholls E, Botías C, Rotheray EL. Bee declines driven by combined stress from parasites, pesticides, and lack of flowers. Science. 2015;347:1255957. doi: 10.1126/science.1255957. [DOI] [PubMed] [Google Scholar]
- 5.Carvell C, et al. Declines in forage availability for bumblebees at a national scale. Biol. Conserv. 2006;132:481–489. [Google Scholar]
- 6.Roulston TH, Goodell K. The role of resources and risks in regulating wild bee populations. Annu. Rev. Entomol. 2011;56:293–312. doi: 10.1146/annurev-ento-120709-144802. [DOI] [PubMed] [Google Scholar]
- 7.Scheper J, et al. Museum specimens reveal loss of pollen host plants as key factor driving wild bee decline in The Netherlands. Proc. Natl. Acad. Sci. 2014;17552:17557. doi: 10.1073/pnas.1412973111. [DOI] [PMC free article] [PubMed] [Google Scholar]
- 8.Kleijn D, Raemakers I. A retrospective analysis of pollen host plant use by stable and declining bumble bee species. Ecology. 2008;89:1811–1823. doi: 10.1890/07-1275.1. [DOI] [PubMed] [Google Scholar]
- 9.Ollerton J, Erenler H, Edwards M, Crockett R. Extinctions of aculeate pollinators in Britain and the role of large-scale agricultural changes. Science. 2014;346:1360–1362. doi: 10.1126/science.1257259. [DOI] [PubMed] [Google Scholar]
- 10.Carvalheiro LG, et al. Species richness declines and biotic homogenisation have slowed down for NW-European pollinators and plants. Ecol. Lett. 2013;16:870–878. doi: 10.1111/ele.12121. [DOI] [PMC free article] [PubMed] [Google Scholar]
- 11.Robinson RA, Sutherland WJ. Post-war changes in arable farming and biodiversity in Great Britain. J. Appl. Ecol. 2002;39:157–176. [Google Scholar]
- 12.Petit S, Stuart RC, Gillespie MK, Barr CJ. Field boundaries in Great Britain : stock and change between 1984, 1990 and 1998. J. Environ. Manage. 2003;67:229–238. doi: 10.1016/s0301-4797(02)00176-7. [DOI] [PubMed] [Google Scholar]
- 13.Blackstock TH, et al. The extent of semi-natural grassland communities in lowland England and Wales : a review of conservation surveys 1978-96. Grass Forage Sci. 1999:1–18. [Google Scholar]
- 14.Ratcliffe DA. Post-medieval and recent changes in British vegetation: the culmination of human influence. New Phytol. 1984;98:73–100. doi: 10.1111/j.1469-8137.1984.tb06099.x. [DOI] [PubMed] [Google Scholar]
- 15.Fuller RM. The Changing Extent and Conservation Interest of Lowland Grasslands in England and Wales : A Review of Grassland Surveys 1930-84. Biol. Conserv. 1987;40:281–300. [Google Scholar]
- 16.Natural England. Countryside Stewardship Manual. 2015. pp. 1–94.
- 17.Carvell C, Meek WRW, Pywell RF, Goulson D, Nowakowski M. Comparing the efficiency of agri-environment schemes to enhance bumble bee abundance and diversity on arable field margins. J. Appl. Ecol. 2007;44:29–40. [Google Scholar]
- 18.Willmer P. Pollination and Floral Ecology. Princeton University Press; Princeton, USA: 2011. pp. 1–778. [Google Scholar]
- 19.Carey PD, et al. Countryside Survey: UK Results from 2007. 2008. pp. 1–105.
- 20.Stamp LD. The land of Britain: its use and misuse. Longmans, Green and Co.; London, UK: 1948. [Google Scholar]
- 21.Kirk GJD, Bellamy PH, Lark RM. Changes in soil pH across England and Wales in response to decreased acid deposition. Glob. Chang. Biol. 2006;16:3111–3119. [Google Scholar]
- 22.Reynolds B, et al. Countryside Survey : National “ Soil Change ” 1978 – 2007 for Topsoils in Great Britain — Acidity, Carbon, and Total Nitrogen Status. Vadose Zo. J. 2013;12 [Google Scholar]
- 23.Boatman ND, Jones NE, Conyers ST, Pietravalle S. Development of plant communities on set-aside in England. Agric. Ecosyst. Environ. 2011;143:8–19. [Google Scholar]
- 24.Breeze TD, Bailey a. P., Balcombe KG, Potts SG. Pollination services in the UK: How important are honeybees? Agric. Ecosyst. Environ. 2011;142:137–143. [Google Scholar]
- 25.Aizen M. a, Garibaldi L. a, Cunningham S. a, Klein AM. Long-term global trends in crop yield and production reveal no current pollination shortage but increasing pollinator dependency. Curr. Biol. 2008;18:1572–5. doi: 10.1016/j.cub.2008.08.066. [DOI] [PubMed] [Google Scholar]
- 26.Staley JT, et al. Changes in hedgerow floral diversity over 70 years in an English rural landscape, and the impacts of management. Biol. Conserv. 2013;167:97–105. [Google Scholar]
Method references
- 27.Preston CD, Pearman DA, Dines TD. New Atlas of the British and Irish Flora: An Atlas of the Vascular Plants of Britain, Ireland, The Isle of Man and the Channel Island. Oxford University Press; Oxford, UK: 2002. p. 910. [Google Scholar]
- 28.Fitter AH, Peat HJ. The Ecological Flora Database. J. Ecol. 1994;82:415–425. [ http://www.ecoflora.co.uk] [Google Scholar]
- 29.Corbet SA, et al. Native or exotic? Double or single? Evaluating plants for pollinator-friendly gardens. Ann. Bot. 2001;87:219. doi: 10.1006/anbo.2000.1322. [DOI] [PubMed] [Google Scholar]
- 30.Carvalheiro LG, Barbosa ERM, Memmott J. Pollinator networks, alien species and the conservation of rare plants: Trinia glauca as a case study. J. Appl. Ecol. 2008;45:1419–1427. [Google Scholar]
- 31.BSBI, Botanical Society of the British Isles 2011 [ http://www.botanicalkeys.co.uk/flora/]
- 32.Kirk WDJ, Howes FN. Plants for bees: a guide to the plants that benefit the bees of the British Isles. International Bee Research Association; Treforest, UK: 2012. pp. 1–311. [Google Scholar]
- 33.Klotz S, Kühn I, Durka W. BIOLFLOR - Eine Datenbank zu biologisch-ökologischen Merkmalen der Gefäßpflanzen in Deutschland. - Schriftenreihe für Vegetationskunde 38. Bundesamt für Naturschutz. 2002 [ http://www2.ufz.de/biolflor/index.jsp]
- 34.Wood CM, Howard DC, Henrys PA, Smart SM. Countryside Survey: Measuring Habitat Change over 30 years 1978 Data Rescue - Final Report. 2012. pp. 1–18.
- 35.Countryside Survey: England Results from 2007. 2009. p. 119.
- 36.R Development Core Team R: A Language and Environment for Statistical Computing. R Foundation for Statistical Computing. 2013 [ http://www.R-project.org]
- 37.Morton RD, et al. Final Report for LCM2007 - the new UK land cover map. Countryside Survey Technical Report No 11/07 NERC/Centre for Ecology & Hydrology (CEH Project Number: C03259) 2011. p. 112.
- 38.Department for Environment Food and Rural Affairs Entry Level Stewardship Handbook Terms and conditions and how to apply PB10355. 2005. p. 116.
- 39.Department for Environment Food and Rural Affairs Higher Level Stewardship Handbook Terms and conditions and how to apply PB10382. 2005. p. 123.
- 40.Raine NR, Chittka L. Nectar Production Rates of 75 Bumblebee-visited Flower Species in a German Flora (Hymenoptera: Apidae: Bombus terrestris) Entomol. Gener. 2007;30:191–192. [Google Scholar]
Associated Data
This section collects any data citations, data availability statements, or supplementary materials included in this article.


