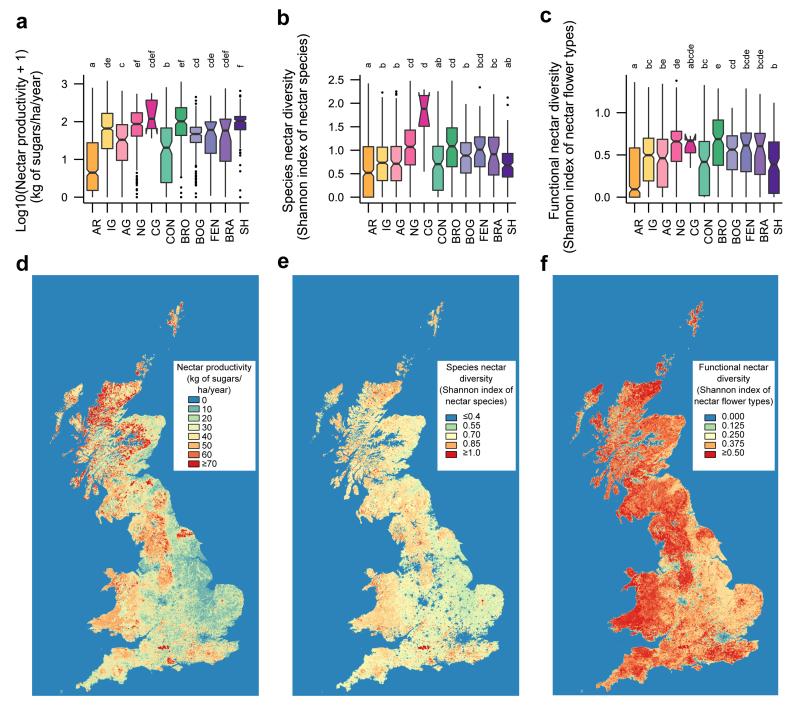
Figure 1. Nectar productivity and diversity in Great Britain in 2007.
a, Box plots of log10 (x+1) nectar productivity (kg of sugars/ha/year) per habitat. b, Box plots of species nectar diversity (Shannon index of nectar species) per habitat. c, Box plots of functional nectar diversity (Shannon index of nectar flower types) per habitat. Box plots are based on 2007 vegetation data (see Supplementary Table 1 for sample sizes). Habitat types (AR=Arable land, IG=Improved grassland, AG=Acid grassland, NG=Neutral grassland, CG=Calcareous grassland, CON=Conifer woodland, BRO=Broadleaf woodland, BOG=Bog, FEN=Fen, BRA=Bracken, SH=Shrub heathland) significantly different from one another are indicated by different letters. d, Map of nectar productivity. e, Map of species nectar diversity. f, Map of functional nectar diversity. Maps are based on 2007 land cover and vegetation data.

