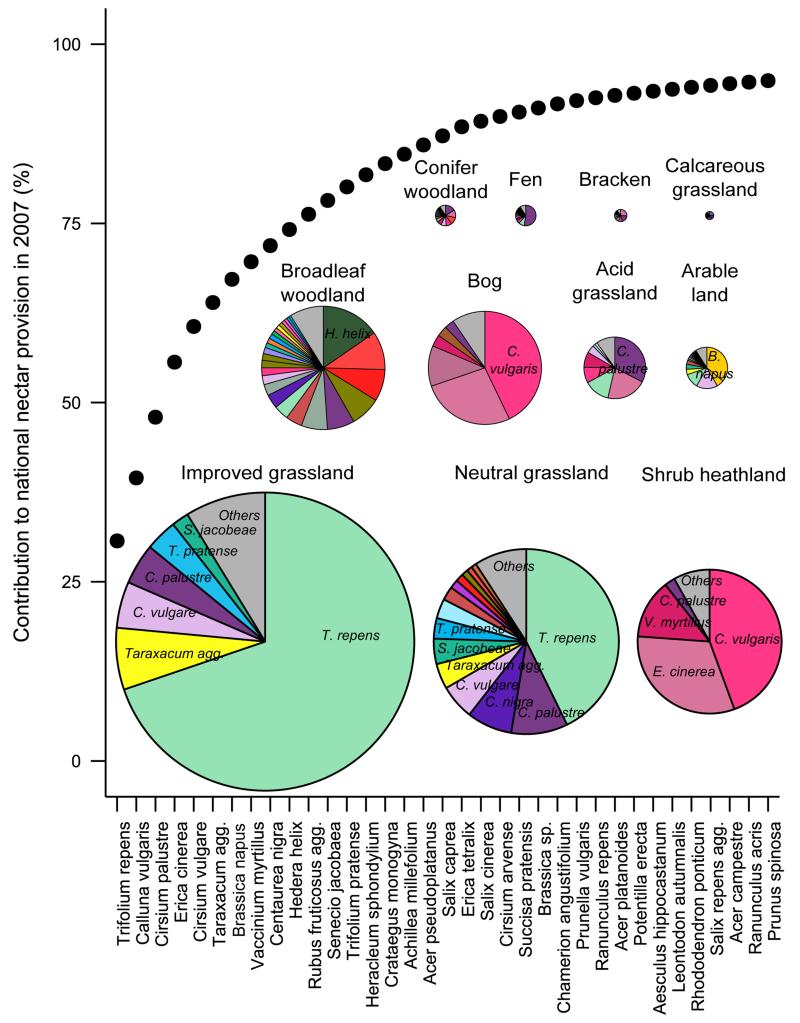
Figure 2. Plant species’ contributions to Great Britain nectar provision and to habitat nectar provision, based on 2007 land cover and vegetation data.
The dotted line represents the cumulative contribution of plant species to the national nectar provision in 2007 (only species that contribute to the first 95% are shown). The pie charts represent the contribution of plant species towards nectar production in each habitat (only the species that contribute to the first 90% are shown) in 2007. The size of each pie chart is proportional to the contribution of each habitat to national nectar provision in 2007.

