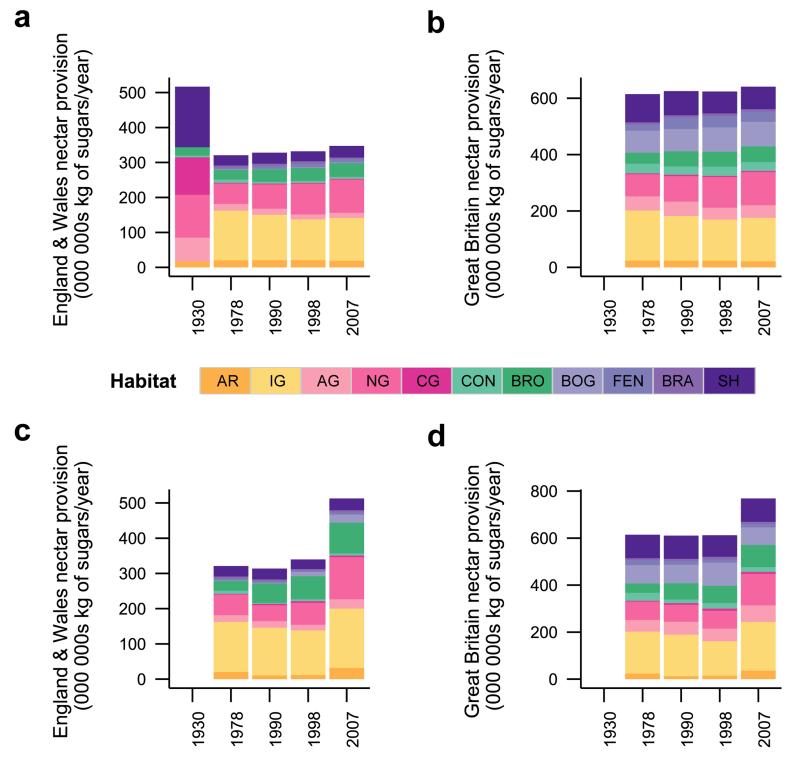
Figure 4. Historical changes in nectar provision (in kg of sugars/year) at the national scale in England & Wales (1930-2007) and in Great Britain (1978-2007).
Nectar provision partitioned by habitat, based on land cover for 1930 (England & Wales only), 1978, 1990, 1998 and 2007, using vegetation data from 1978 for all years (assuming unchanged nectar productivity within habitats across time) in a, England & Wales and b, Great Britain. Nectar provision partitioned by habitat, based on land cover and vegetation data for 1978, 1990, 1998 and 2007 in c, England & Wales and d, Great Britain. See Figure 1 for habitat type codes and Supplementary Table 5 for habitat land cover values.

