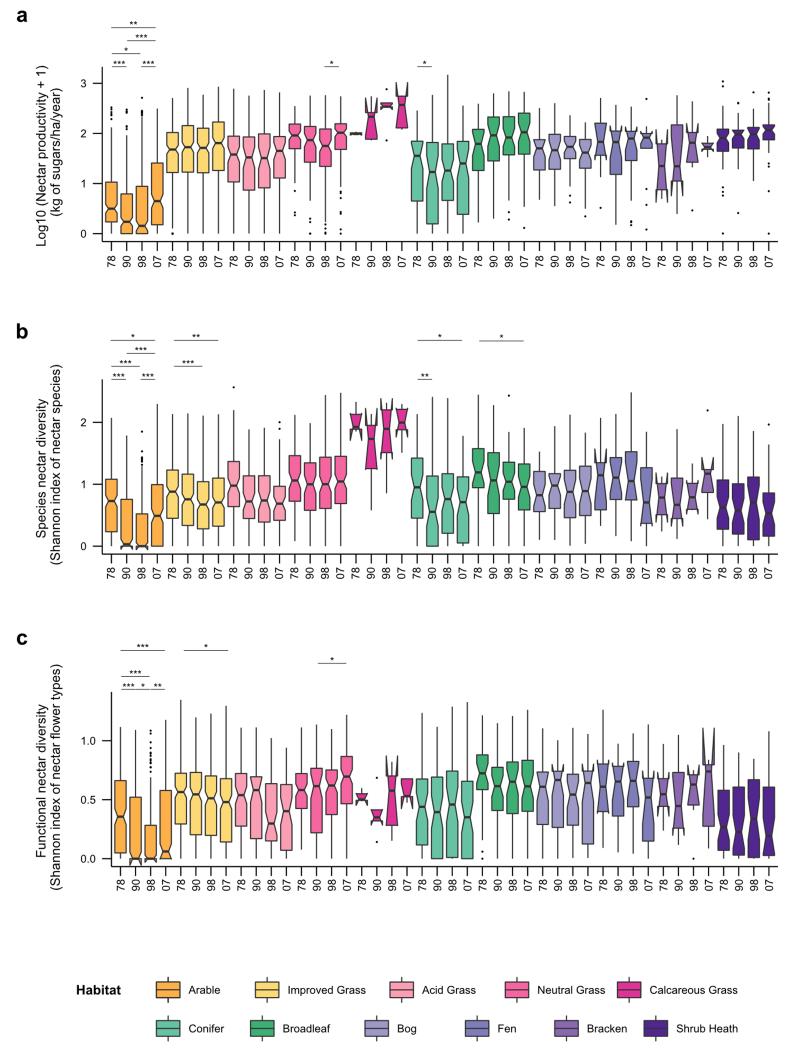
Extended Data Figure 2. Historical changes in nectar productivity and diversity per habitat over recent decades (1978 to 2007).
a, Box plots of log 10 (x+1) nectar productivity per habitat, based on vegetation data for 1978, 1990, 1998 and 2007. b, Box plots of species nectar diversity per habitat, based on vegetation data for 1978, 1990, 1998 and 2007. c, Box plots of functional nectar diversity per habitat, based on vegetation data for 1978, 1990, 1998 and 2007. Significant differences of time periods per habitats are indicated by stars (* for p ≤ 0.05; ** for p ≤ 0.01; *** for p ≤ 0.001). See Extended Data Table 1 for ANOVA results.

