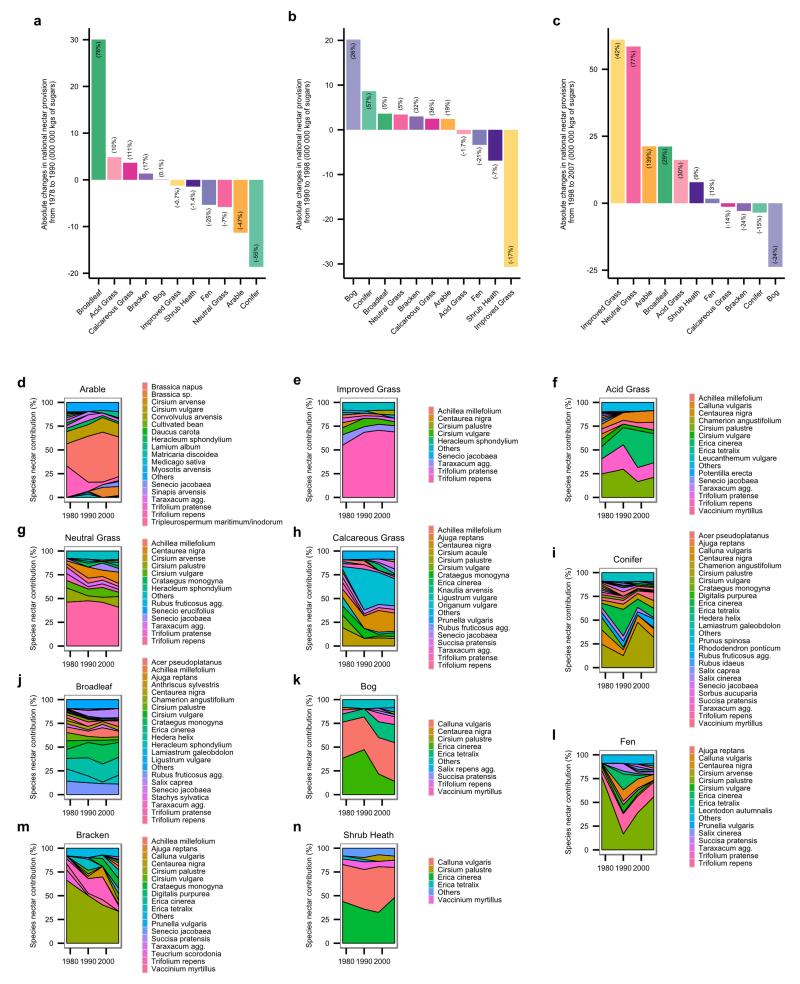
Extended Data Figure 3. Habitat contributions to the national nectar provision shifts and species contributions to habitats over recent decades (1978 to 2007).
Habitat contributions to the national nectar provision changes from a, 1978 to 1990 b, 1990 to 1998 and c, 1998 to 2007. All barplots represent the absolute changes (in 000 000 kg of sugars) for each habitat during the time period considered. Numbers in brackets indicate the relative changes (in %). Species contributions to nectar provision in 1978, 1990, 1998 and 2007 per habitat type (panels d-n). Only species that contribute to the first 90% are shown. See Supplementary Table 10 for main contributing species to the national changes from 1978 to 2007.

