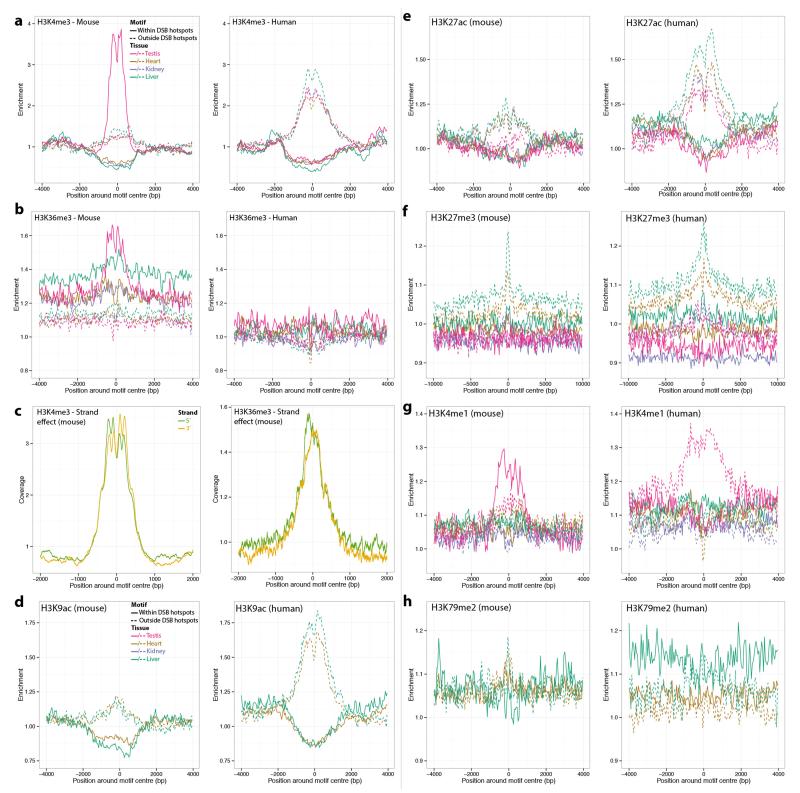
Extended Data Figure 5. Differential epigenetic mark distributions at PRDM9 binding motifs.
a, Enrichment of H3K4me3 marks at mouse motifs that are either within a B6 (left) or human (right) PRDM9 allele controlled DSB hotspot, or outside such a hotspot. The enrichment is relative to a control genomic track. Given the spread of the distributions, the interaction range between the histones and the DSB hotspot seems to be ~1.5 kb on each side of the motif. b, As a, for H3K36me3 marks. c, Mean coverage of H3K4me3 (left) or H3K36me3 (right) signal around the mouse motif nearest to each B6 DSB hotspot, split according to the strand on which the motif lies. d-h, As a, for H3K9ac (d), H3K27ac (e), H3K27me3 (f), H3K4me1 (g) and H3K79me2 (h) marks. All ChIP-seq data for histone modifications used in this analysis were obtained from the Mouse Encode Project.

