
Fig. 5.
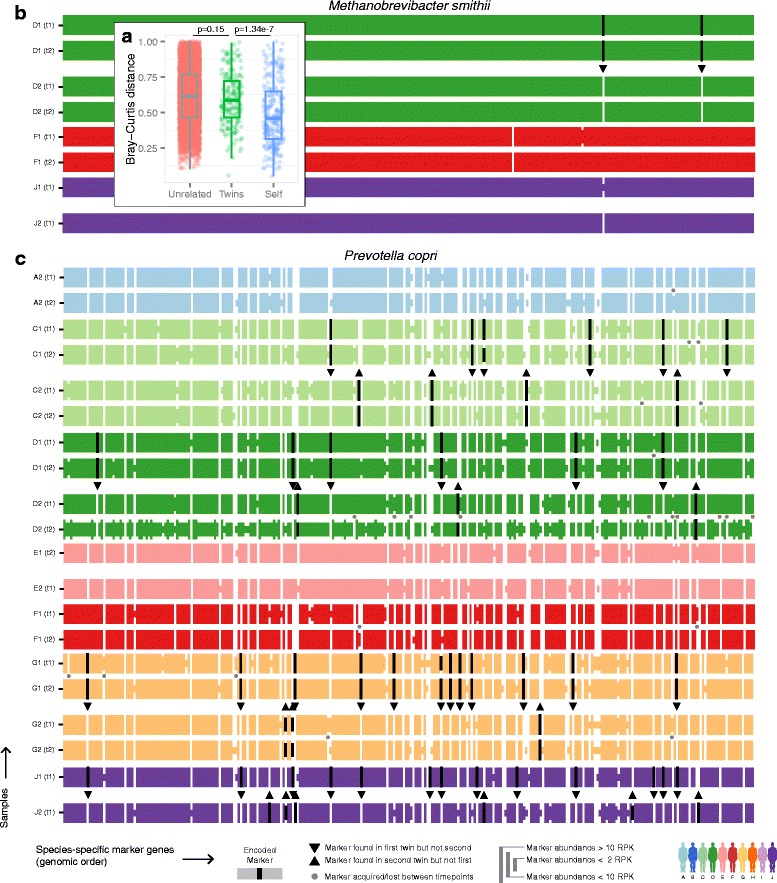
Strain profiles between unrelated, twins, and samples from the same individual over time. a Bray-Curtis dissimilarities of marker gene profiles indicative of strain similarity between unrelated, twins, and the same person over time (P values comparing unrelated vs. twins and twins vs. self are calculated by t-test). b, c The abundances of (b) Methanobrevibacter smithii and (c) Prevotella copri marker gene [18] profiles (see Methods). Each row represents one sample, colored by twin, containing vertical lines each representing one species-specific marker gene’s abundance as binned into four levels. Markers that are present only in one of the twins appear in black, with a triangle pointing to the absent (white) marker. Markers that differ between samples of the same person over time are marked with a gray dot