
Figure 4.
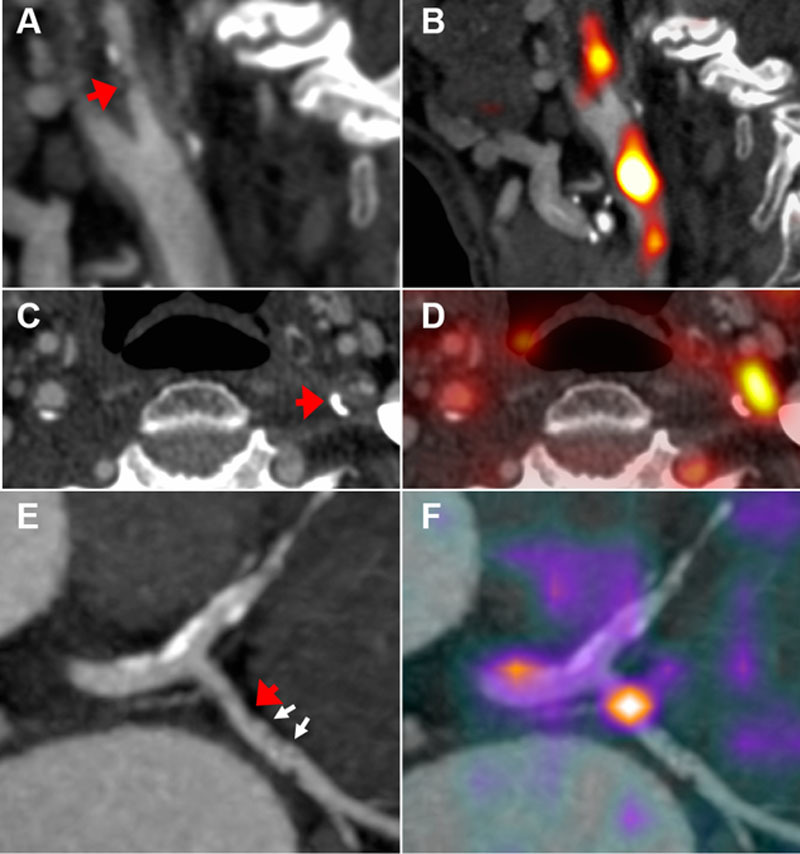
Positron emission tomography (PET) inflammation imaging. Computed tomographic (CT) angiography of symptomatic left internal carotid stenosis (arrows); sagittal (A) and axial (C) views. B, D, Fused 18F-fluorodeoxyglucose (FDG) PET–CT demonstrates high uptake relating to the symptomatic carotid plaque. E, Coronary CT angiogram of left circumflex coronary artery lesion (red arrow) with spotty calcification (white arrows); F, fused 68Ga-DOTATATE PET–CT demonstrates high signal in relation to the inflamed coronary plaque.