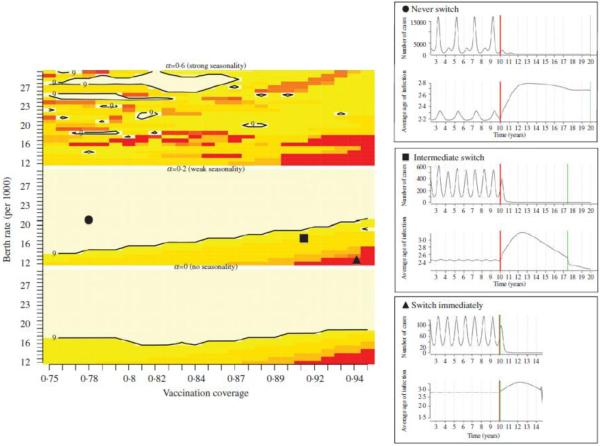
Fig. 3.
Optimal time in years, over 10 years, for switching from 9–11 to 12–14 months vaccination as a function of the birth rate/1000 per year (x axis) and vaccination coverage (y axis), identified as the switching time leading to the fewest number of cases weighted by mortality risk; shown for three different levels of seasonality, as in Fig. 1. The time series in the right-hand panels show incidence and average age of infection where α = 0·2, for the three main cases: (i) never switch to 12–14 months [top panel, corresponding to the birth and vaccination level shown by the circle (●)]; (ii) switch at an intermediate level (middle panel, ■); (iii) switch immediately (bottom panel, ▲).

