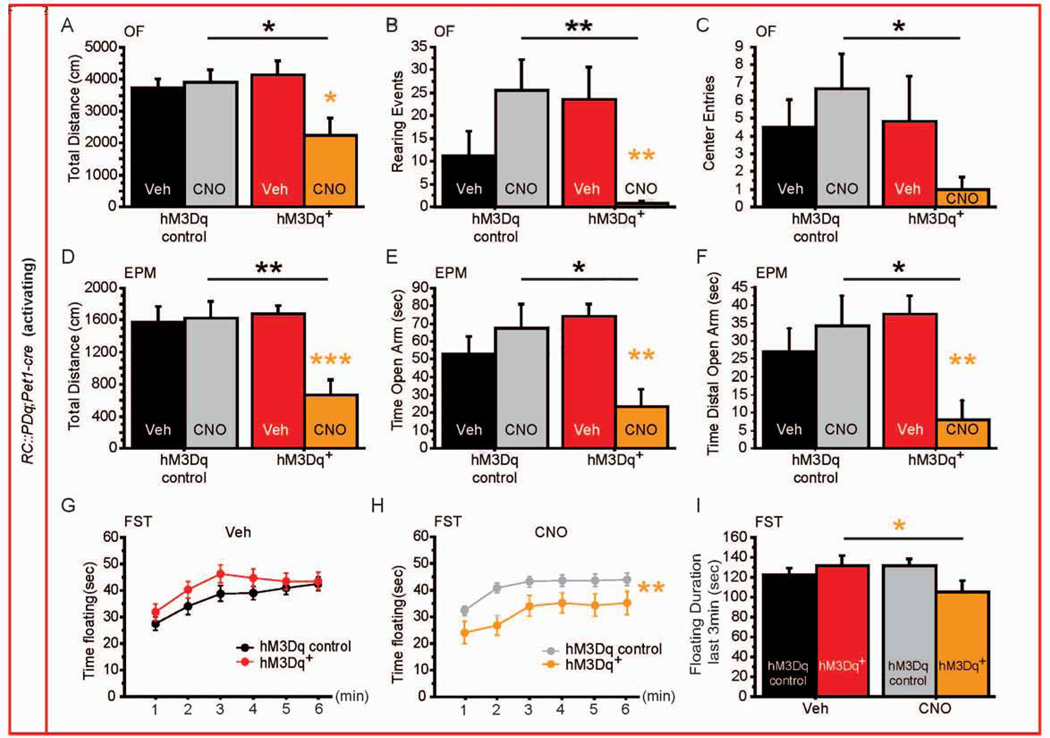
Figure 2. Behavioral consequences of increasing 5-HTergic neuronal activity.
(A–C) hM3Dq+ mice exposed to CNO display decreased distance travelled (A), rearing events (B), and number of entries to the center (C) in the OF when compared with hM3Dq controls exposed to CNO or hM3Dq+ mice exposed to Veh. n = 6–12 per genotype and treatment.
(D–F) hM3Dq+ mice exposed to CNO display decreased distance travelled (D), time spent in the open arm (E) and time spent in the distal part of the open arm (F) in the EPM when compared with hM3Dq controls exposed to CNO or hM3Dq+ mice exposed to Veh. n = 6–12 per genotype and treatment.
(G, H) Time spent floating during 6min of the FST after Veh (G) and CNO (H) injections shows a reduction in floating specific to hM3Dq+ mice exposed to CNO. n = 15–25 per genotype and treatment.
(I) During the last 3 min of the FST, hM3Dq+ mice float less when exposed to CNO. n = 15–25 per genotype and treatment.
#: p < 0.1; *: p < 0.05; **: p < 0.01; ***: p < 0.001. EPM: elevated plus maze, OF: open field, FST: forced swim test.

