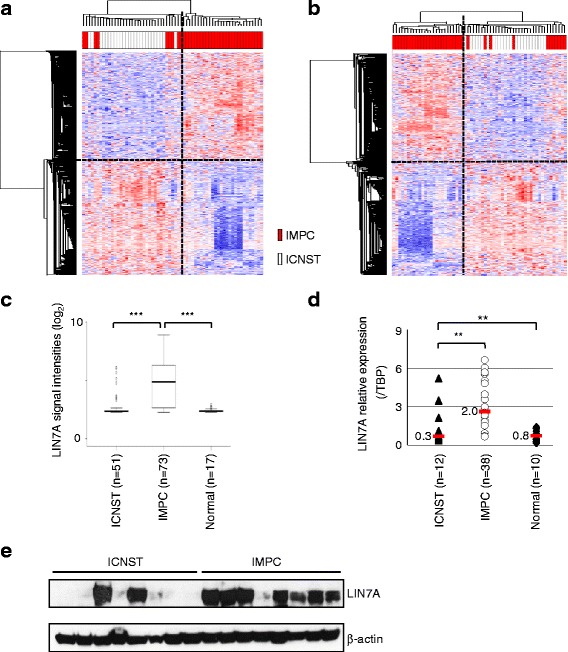
Fig. 2.

Specific invasive micropapillary carcinoma (IMPC) gene expression signature. a, b Human Genome U133 set (HG-U133 Plus 2.0) were simultaneously normalized using the GC Robust Multi-array Average package version 2.22.0 to assess the levels of expression of the gene probe sets. Unsupervised hierarchical clustering was performed with the differentially expressed 1108 genes in the training set (a) composed of 63 tumors (37 IMPC and 26 invasive carcinomas of no special type (ICNST)) and in the validation set (b) (61 tumors: 36 IMPC and 25 ICNST). Each column represents a different tumor and each row represents one of 1108 genes. Red bars IMPC, white bars ICNST. c LIN7A gene expression levels according to Affymetrix U133 Plus 2.0 signal in ICNST (n = 51), IMPC (n = 73) and normal breast tissues obtained from mammoplasties (n = 17). P values are based on the Welch two-sample t test; ***p value ≤0.001. d RT-qPCR on LIN7A expression in ICNST (n = 12, black triangles), IMPC (n = 38, white circles) and normal breast samples (n = 10, black diamonds). LIN7A gene expression levels are plotted on the TBP gene expression levels. Median values are indicated (red bars). P values were calculated with the Welch t test and are indicated above the box-plot; **p value ≤0.01. e Western-blot analysis of LIN7A expression in ICNST (n = 8) and IMPC (n = 8) tumors. Blots were incubated with anti-LIN7A or anti-β-actin antibodies as internal control for protein loading
