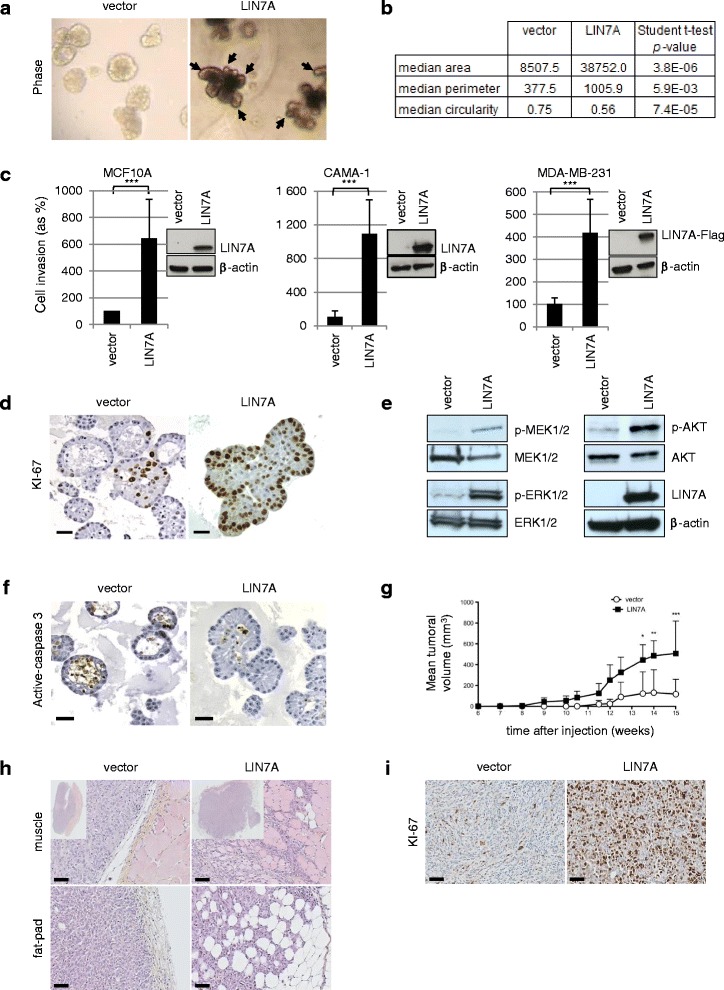
Fig. 3.

Over-expression of LIN7A disrupts apico-basal polarity, increases proliferation in vitro and enhancestumor growth in vivo. a Phase-contrast images of acinar structures obtained with MCF10A-vector (left) and MCF10A-LIN7A (right) cells (G × 630 magnification). Arrows point to the protrusions from the multi-acinar structures. b Area, perimeter and circularity of MCF10A-vector and MCF10A-LIN7A acini cultured in Matrigel™. Measurements were performed on five independent hematoxylin-and-eosin (HES) stained sections using Adobe Photoshop (Student t test). For circularity, a value of 1.0 indicates a perfect circle. c Quantification of LIN7A-expressing cells invasive potential (MCF10A, left panel; CAMA1, central panel; MDA-MB-231, right panel). ***p-value ≤0.001 (Student t test). d Representative views of KI-67 immunostaining in MCF10A-vector (left panel) and in MCF10A-LIN7A (right panel) acini. Scale bars 20 μm. G × 200 magnification. e Western-blot analysis on MCF10A-vector and MCF10A-LIN7A 3D whole-cell extracts. f Active-caspase-3 stainings of MCF10A-vector (left) and MCF10A-LIN7A (right) acini. Scale bars 20 μm. G × 200 magnification. g Tumor growth in CB17-SCID mice orthotopically injected into the mammary fat pad with MDA-MB-231-vector or MDA-MB-231-LIN7A cells. Curves represent the tumor volume according to time for MDA-MB-231-LIN7A (black squares) and the MDA-MB-231-vector control (white circles); *p value ≤0.05,**p value ≤0.01, ***p-value ≤0.001 (two-way analysis of variance, Bonferroni posthoc test). h Representative pictures of HES stained sections in mice muscle (top panel) or fat-pad (bottom panel) of the MDA-MB-231-vector (left panel) and MDA-MB-231-LIN7A (right panel) tumors, 15 weeks after injection. Scale bars 50 μm. i Representative pictures of KI-67 staining in MDA-MB-231-vector (left panel) and MDA-MB-231-LIN7A (right panel) tumors. Scale bars 50 μm
