
Fig. 1.
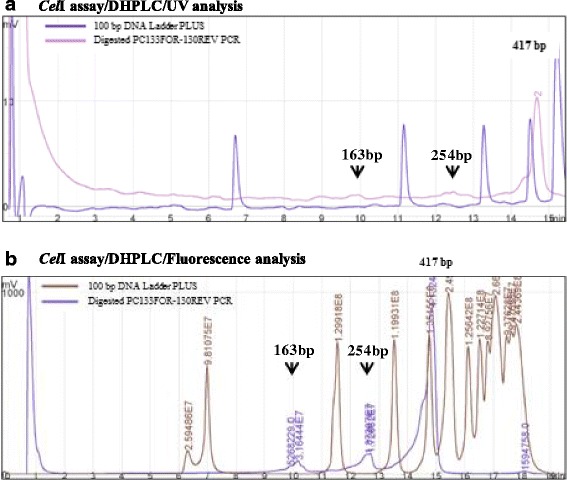
Comparisons of CelI/DHPLC analysis using UV detector (a) and fluorescent detector (b). Chromatograms show the DHPLC run of PC133f-PC130r amplicons from mixed DNA. All runs are compared to 100 bp DNA Ladder PLUS. The black arrows indicate the putative expected heteroduplex molecules. The number above the main peak marked the region amplified length