
Fig. 3.
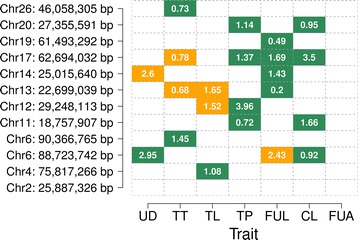
Effects of 12 QTL on seven udder conformation traits. Green and orange colors represent positive and negative phenotype × genotype associations, respectively, for 12 QTL in seven single-trait association studies. The values in the rectangles represent the proportion of DYD variance explained for each QTL. The abbreviations of the traits are in Table 1. Only associations with a P less than 2.97 × 10⁻⁹ (5 % Bonferroni-corrected significance threshold for 16,816,809 tests) are shown