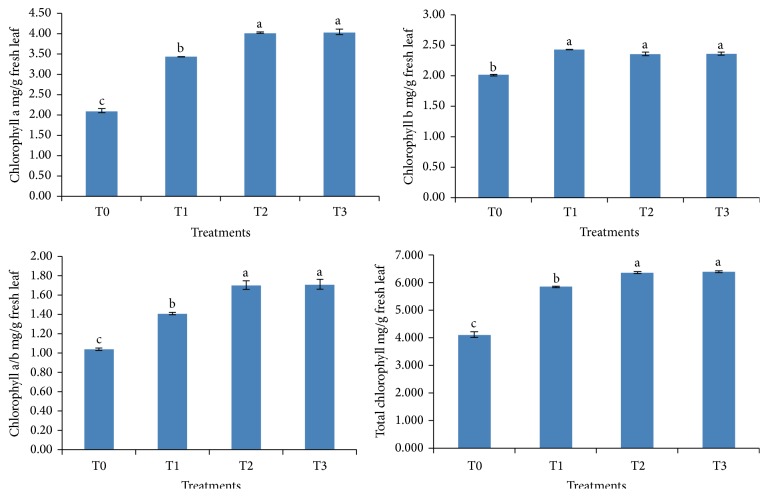
Figure 2.
Effect of PGPR inoculation on chlorophyll content of okra leaves under salt stress. T0: noninoculated salt treated plants, T1: UPMR2 inoculated salt treated plants, T2: UPMR18 inoculated salt treated plants, and T3; both UPMR2 and UPMR18 inoculated salt treated plants. Error bars refer to standard error of means of four replicates. Means within columns with the same letters are not significantly different at p < 0.05.

