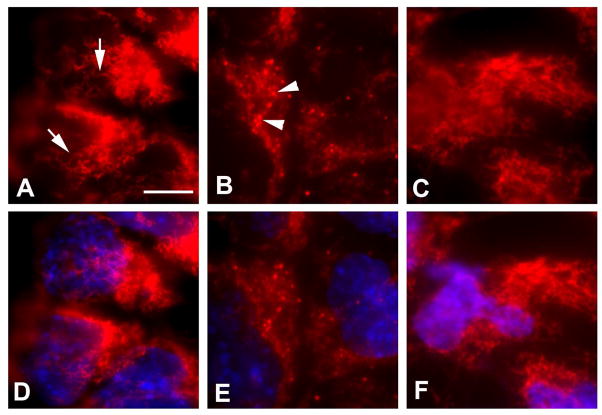
Fig. 4. Effect of PLC inhibition on mitochondrial morphology in high glucose.
(A,B,C) MitoTracker Red. (D,E,F) Merged images of MitoTracker Red and DAPI (blue). (A,D) NG+VEH. (B,E) HG+VEH. (C,F) HG+U73122 (0.5 μM). Arrows in A and arrowheads in B indicate long and fragmented mitochondria, respectively. Scale bar, 10 μm for all images.

