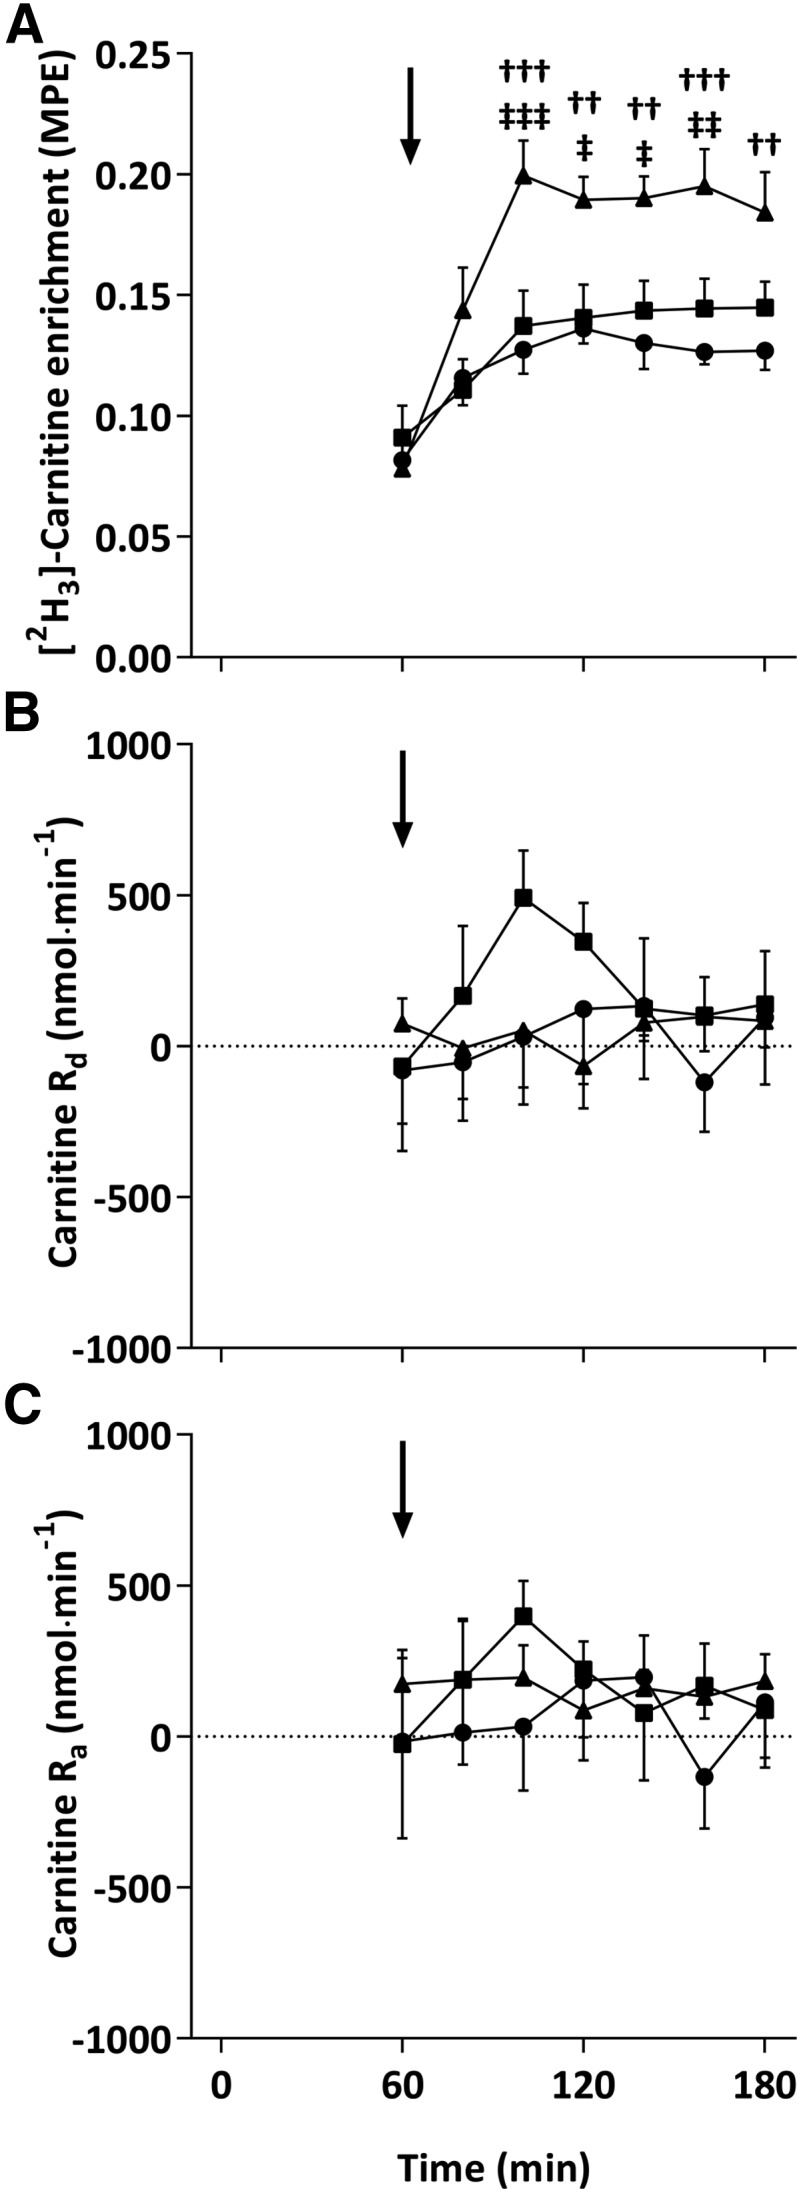
FIGURE 4.

Arterialized venous plasma [3H2]-carnitine enrichment (MPE; A), Rd (B), and Ra (C) after ingestion of 4.5 g l-carnitine tartrate (t = 0 min) and a 500-mL drink (arrows) containing flavored water (CON; circles), 80 g carbohydrate (squares), or 40 g carbohydrate + 40 g whey protein (triangles) at t = 60 min. Values are means ± SEs (n = 7) and were compared by using 2-factor (drink × time) ANOVA with Tukey’s or Bonferroni tests used for post hoc subgroup comparisons after the observation of a significant main or interaction effect, respectively. An interaction effect (P < 0.001) was found for plasma [3H2]-carnitine enrichment with post hoc subgroup comparisons denoted as follows: ††P < 0.01 and †††P < 0.001 (CHO-PRO compared with CON); ‡P < 0.05, ‡‡P < 0.01, and ‡‡‡P < 0.001 (CHO compared with CHO-PRO). CHO, carbohydrate; CHO-PRO, carbohydrate+protein; CON, control; MPE, molar percent excess; Ra, rate of carnitine appearance; Rd, rate of carnitine disappearance.
