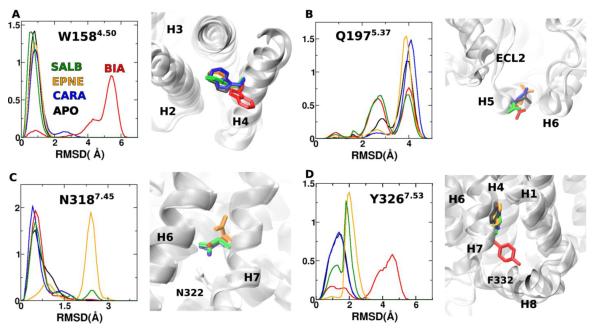
Figure 3.
RMSD distributions of A) W158, B) Q197, C) N318 and D) Y326. These residues were identified using DIRECT-ID to have significant differences in their conformational motions between β2AR bound to agonists (BIA or EPNE) vs. CARA. Snapshot at 400 ns (where the RMSD values are near the maximum of the probability distributions) reveal the differences in conformations for each of these residues of β2AR in the apo state (black), bound to CARA (blue), BIA (red), EPNE (orange) and SALB (green).

