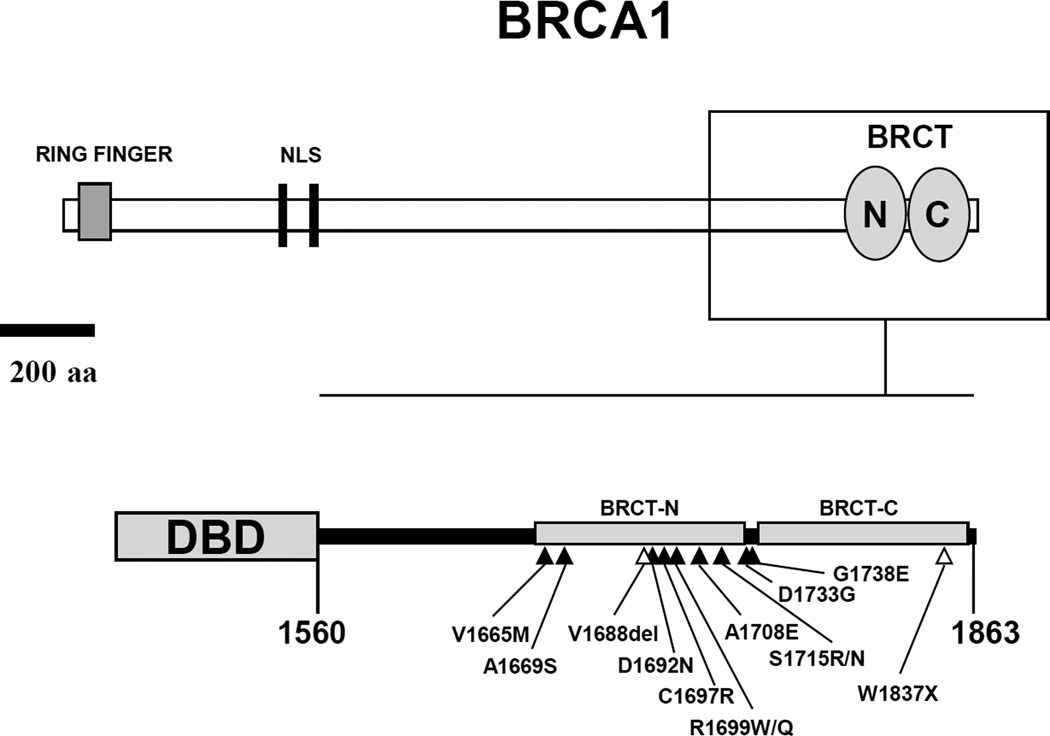
Figure 1. Domain structure of BRCA1.
Top panel. Schematic representation of full length BRCA1 protein featuring the RING domain in the N-terminal region and the BRCT domains in the C-terminal region. The region analyzed in this study (aa 1560–1863) is contained in the box, which is enlarged and represented in the bottom panel. Gray circles represent the two BRCT domains, BRCT-N (aa 1649–1736) and BRCT-C (aa 1756–1855). NLS, nuclear localization signals. Bottom panel. GAL4- and LexA- DNA binding domain (DBD) fusions to BRCA1 C-terminal region (aa 1560–1863). Mutations analyzed in this study are depicted as black (missense) or open (nonsense and in-frame deletion) triangles.

