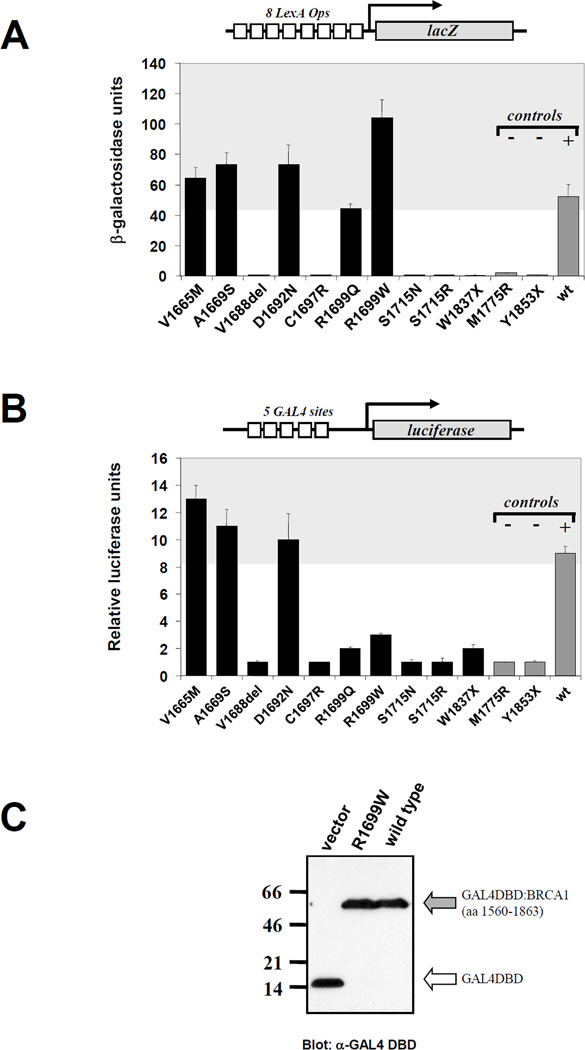
Figure 3. Transcriptional activity of BRCA1 variants.
A. Activity in yeast cells. Structure of the reporter plasmid is depicted on top of the graph. Variants (black bars) are in order of location in the structure of BRCA1 with the exception of last three constructs (gray bars), which correspond to negative (M1775R and Y1853X) and positive (wild type) controls. Shaded area represents range of activity equal or higher than wild type. B. Activity in human cells. Structure of the reporter plasmid is depicted on top of the graph. Variants (black bars) are in order of location in the structure of BRCA1 with the exception of last three constructs (gray bars), which correspond to negative (M1775R and Y1853X) and positive (wild type) controls. Shaded area represents range of activity equal or higher than wild type. C. Mutant R1699W is expressed at the same level as wild type (gray arrow). White arrow indicates expression of the GAL4 DBD moiety in the absence of any fusion fragment.

