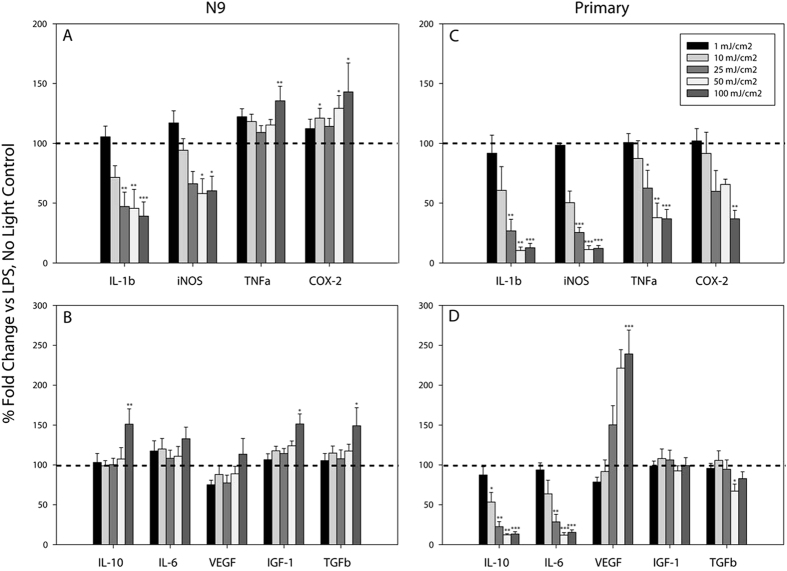
Figure 2. Blue light dose-dependently alters LPS-stimulated microglial inflammatory gene expression.
Blue light (450 nm) was delivered for 1 second per minute for 6 hrs at the indicated energy doses, to cells treated with vehicle or 1 μg/mL LPS. Data are graphed as means + 1 SEM of light-induced % change in LPS-stimulated gene expression relative to that observed in the presence of LPS and absence of light (dotted line). (a) Expression of pro-inflammatory and (b) anti-inflammatory/growth factor genes in N9 microglia (n = 6 each light condition). (c) Expression of pro-inflammatory and (d) anti-inflammatory/growth factor genes in primary microglia (n = 3 light doses 1, 10, 25, 50 mJ/cm2; n = 6 light dose 0, 100 mJ/cm2). *P < 0.05, **P < 0.01, ***P < 0.001 vs. no light control by Holm-Sidak test or Tukey test (LPS-treated: Tgfβ, Igf-1, Cox-2).

