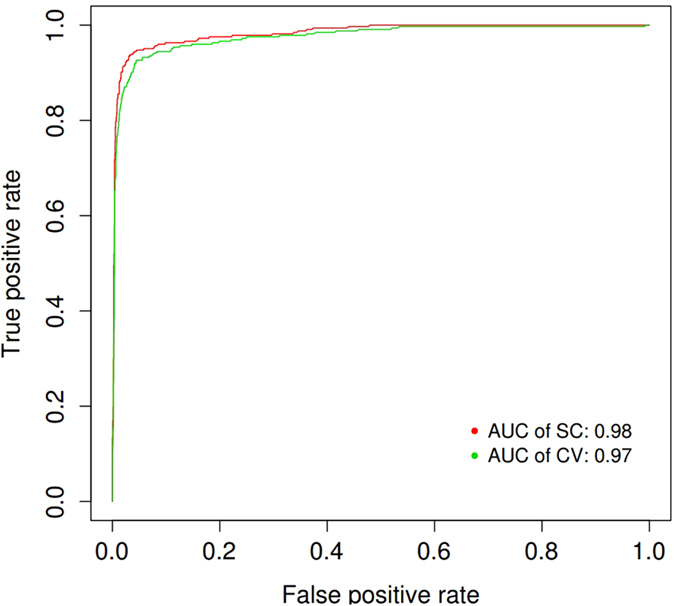
Figure 1. Receiver operating characteristic (ROC) curves of the CM classifier.

The ROC values for the self-consistency and cross validation are plotted. The red and green curve represent the ROC curve for self-consistency and ten-fold cross validation for training dataset separately. The legend lists the value of the area under the receiver operating characteristic curve (AUC).
