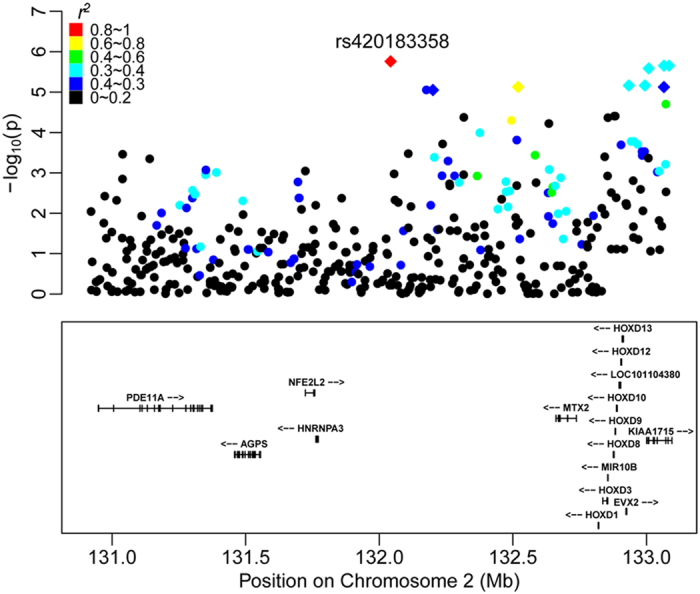
Figure 3. Plot of regional association results for loci surrounding the most significant SNP rs420183358 (red rhombus).

Different colours represent the r2 values of pair-wise LD estimates. Functional genes in this region are plotted in the box. The rhombus represents the top ten SNPs of GWA analysis. The yellow dot represents rs403275219.
