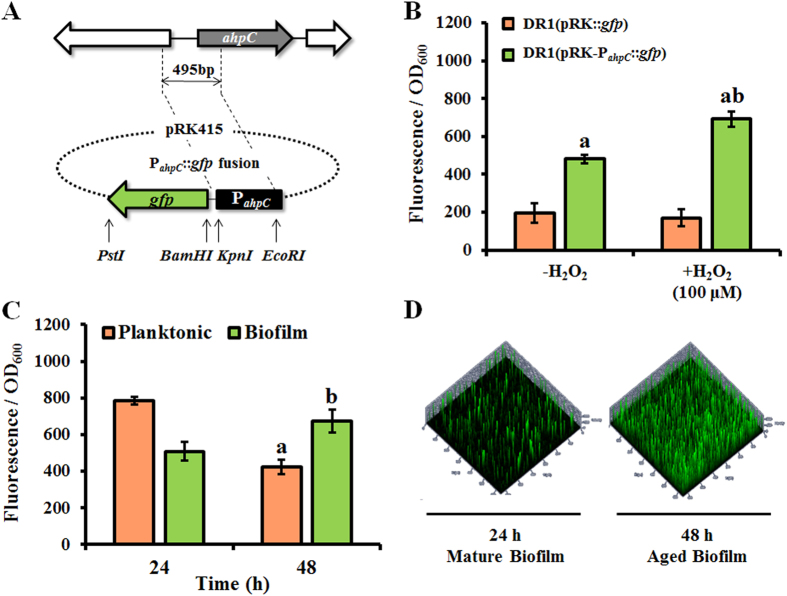
Figure 1. Analysis of ahpC gene expression.
(A) Construction of the ahpC promoter gfp bioreporter. (B) Expression from the ahpC promoter by cells grown in LB medium with and without H2O2 (100 μM). (C) GFP fluorescence intensity of planktonic cells and biofilms grown in LB medium at 24 and 48 h. (D) CLSM images of the ahpC::gfp reporter strain in biofilms at 24 and 48 h. All samples were analyzed in triplicate. Statistical analyses were conducted using Student’s t-test. A letter on the bar graph indicates the level of significance.

